
SiteHive Weather
SiteHive Weather combines an on-site SiteHive Hexanode Weather device with SiteHive Enviro to give your team real-time hyperlocal weather monitoring, intelligent forecasting and contextual insights. Plan works, respond to weather risks and document site conditions from the same platform you already use for noise, dust, vibration and water.
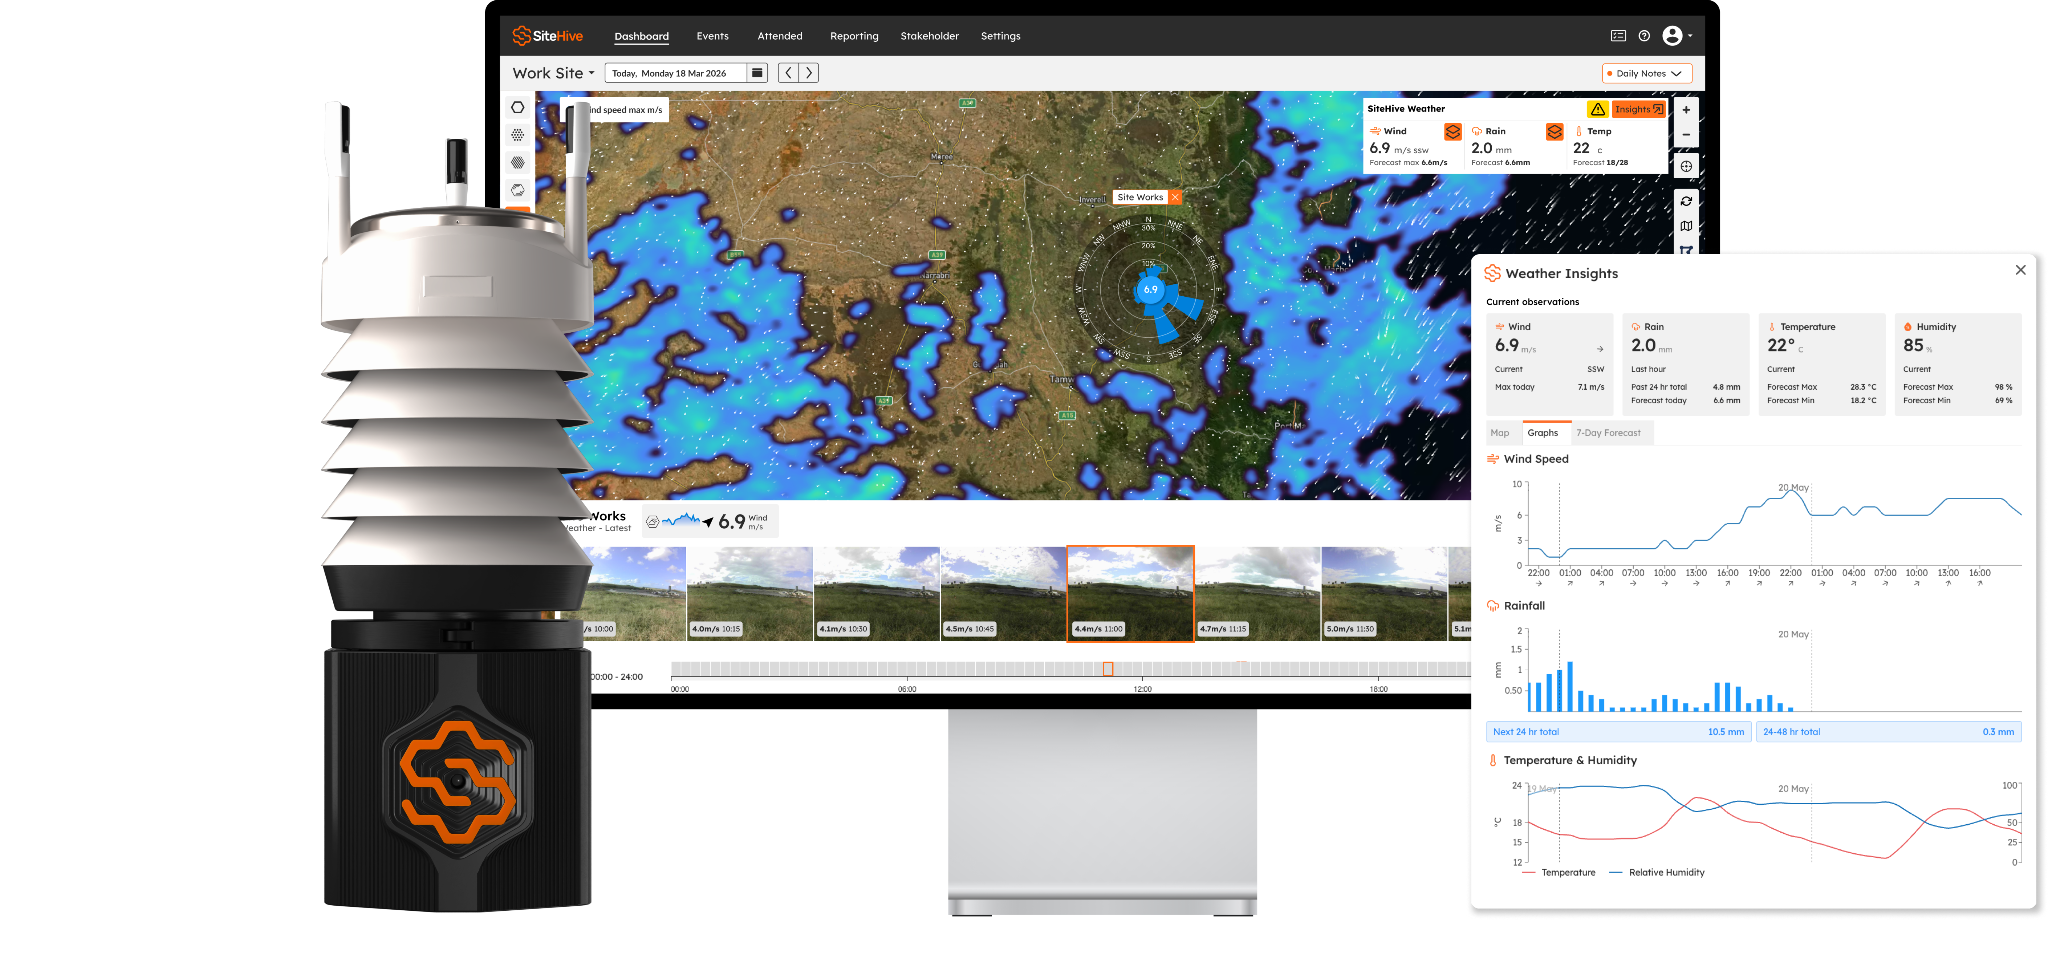
What is SiteHive Hexanode Weather?
What is SiteHive Hexanode Weather?
SiteHive Hexanode Weather device is an easy-to-deploy, on-site weather station that measures hyperlocal conditions and streams them straight into your SiteHive Enviro dashboard, alongside your environmental monitoring data.
The device measures the conditions that matter on site:
Parameter |
What it helps with |
|---|---|
Temperature and humidity |
Heat stress awareness and daily planning |
Rainfall |
Surface water inspections, erosion and sediment controls |
Wind speed and gusts |
Crane and lifting operations, dust management |
Wind direction |
Understanding dust movement toward sensitive receivers |
Rather than jumping between public weather apps, phone forecasts and separate data portals, your team gets one accurate picture of conditions, in context with the rest of your site data.
What we offer
Hyperlocal real-time weather measurements
See current site conditions at a glance and make quick, informed decisions during the day.
Weather forecast
A daily summary and weekly forecast, integrated directly into your dashboard map, so you can plan the days ahead.
Automated weather alerts
Set rules and notifications for wind gusts, cumulative rainfall, rainfall intensity and heat (wet bulb temperature) to proactively manage weather-related risk. Site-wide rainfall notifications can also let your team know at 8 am if rainfall exceeded your nominated amount in the past 24 hours.
Integrated environmental context
Weather data sits alongside noise, dust and vibration, and weather-affected periods are highlighted on your graphs, making it easier to interpret environmental impacts.
Timelapse images
The device captures images every 15 minutes, so you can visually confirm weather conditions on site.
Historical records and reporting
Review past conditions and generate PDF reports, CSV exports and Stats & Analysis tables to support reporting, investigations and claims.
ℹ️ To start using SiteHive Weather on your project, reach out to your BDM or contact support@sitehive.com.
How it works
On site
The SiteHive Hexanode Weather device is designed for construction sites: quick to deploy, with no professional installation or ongoing maintenance required. The device samples conditions every minute using industrial-grade sensors and sends data to the cloud over 4G or Wi-Fi. It also captures a site image every 15 minutes.
In SiteHive Enviro
Incoming data is aggregated and displayed in your dashboard within seconds. Rainfall is accumulated across the period, so you always see meaningful totals.
💡 Make sure your site location is set correctly in Site Details, so your forecast and weather data reflect your exact site.
ℹ️ SiteHive Enviro Pro adds finer aggregation periods (1, 5 and 15 minutes) and map layers such as wind and rain radar. On standard Enviro, weather data is aggregated in 15-minute periods.
Dashboard and reporting
Dashboard
The weather insight component on your site map shows a daily summary of recorded conditions plus the weekly forecast.
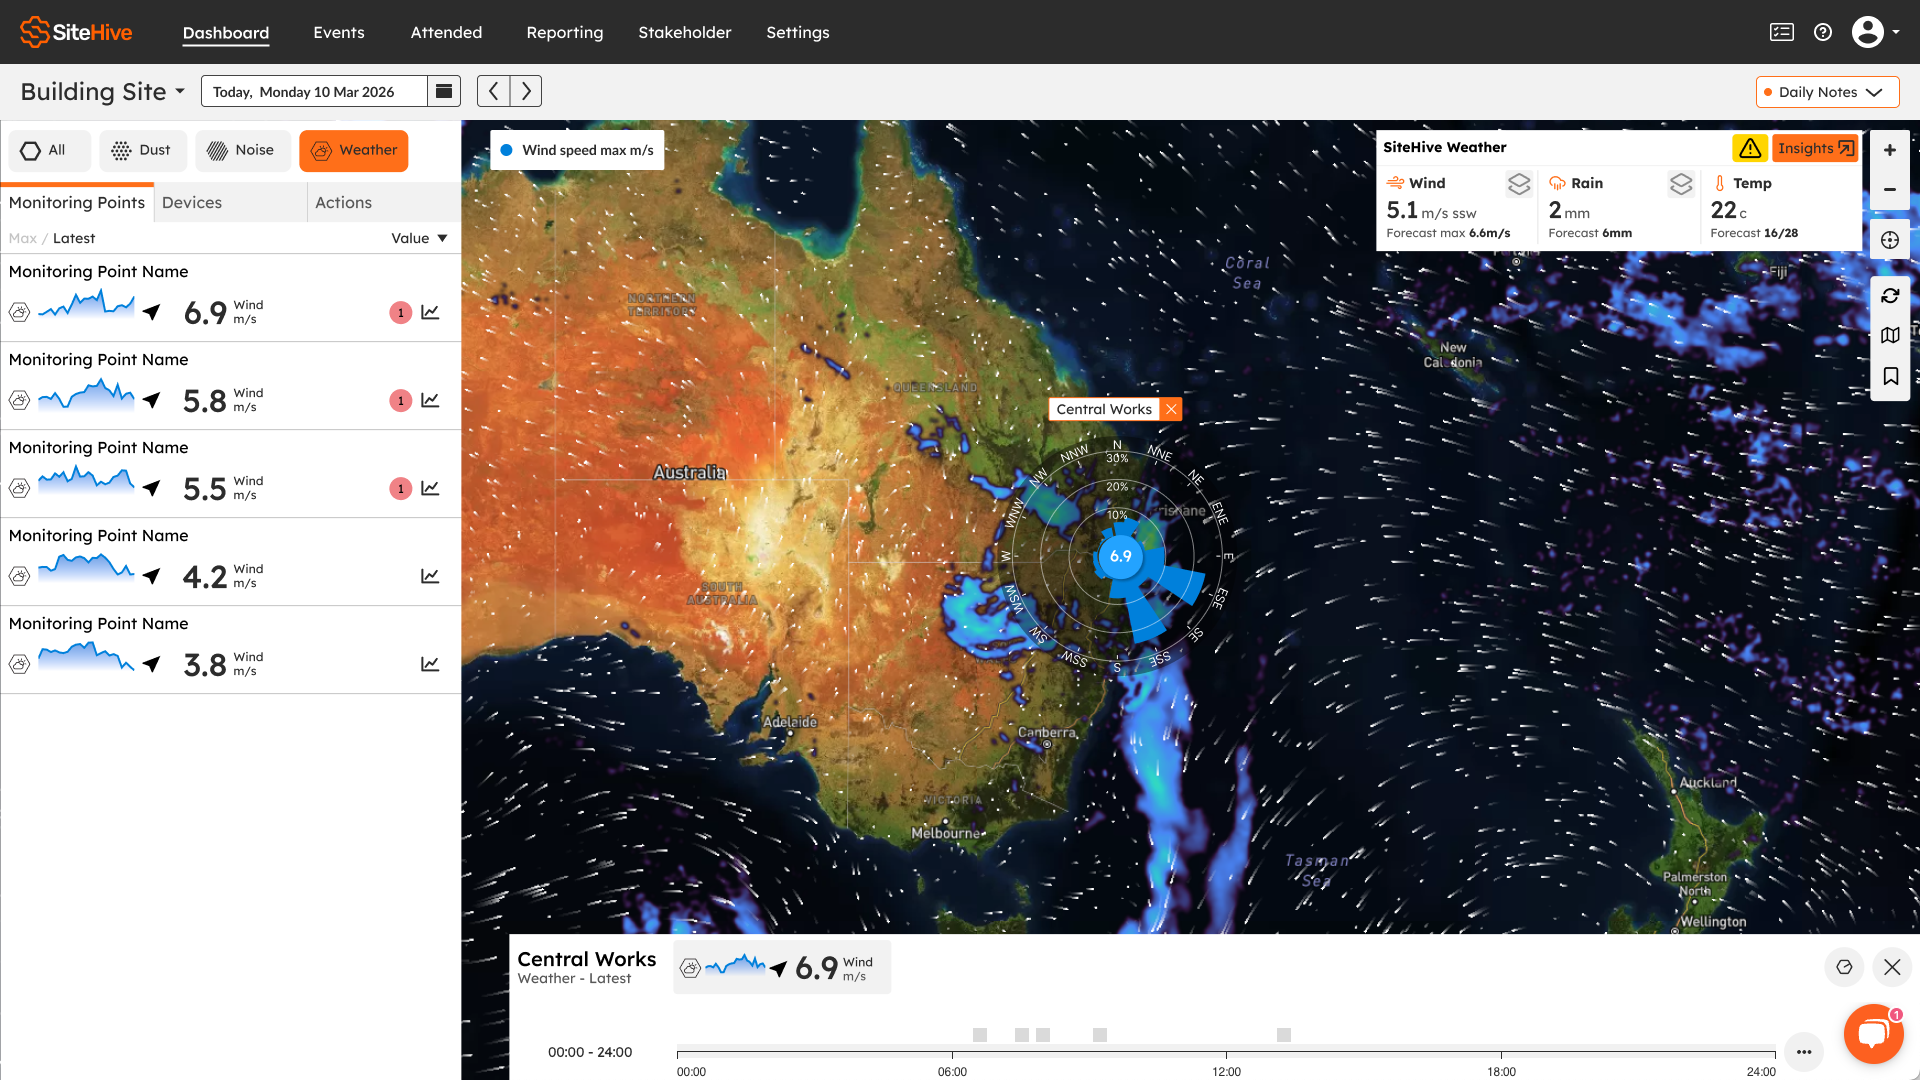
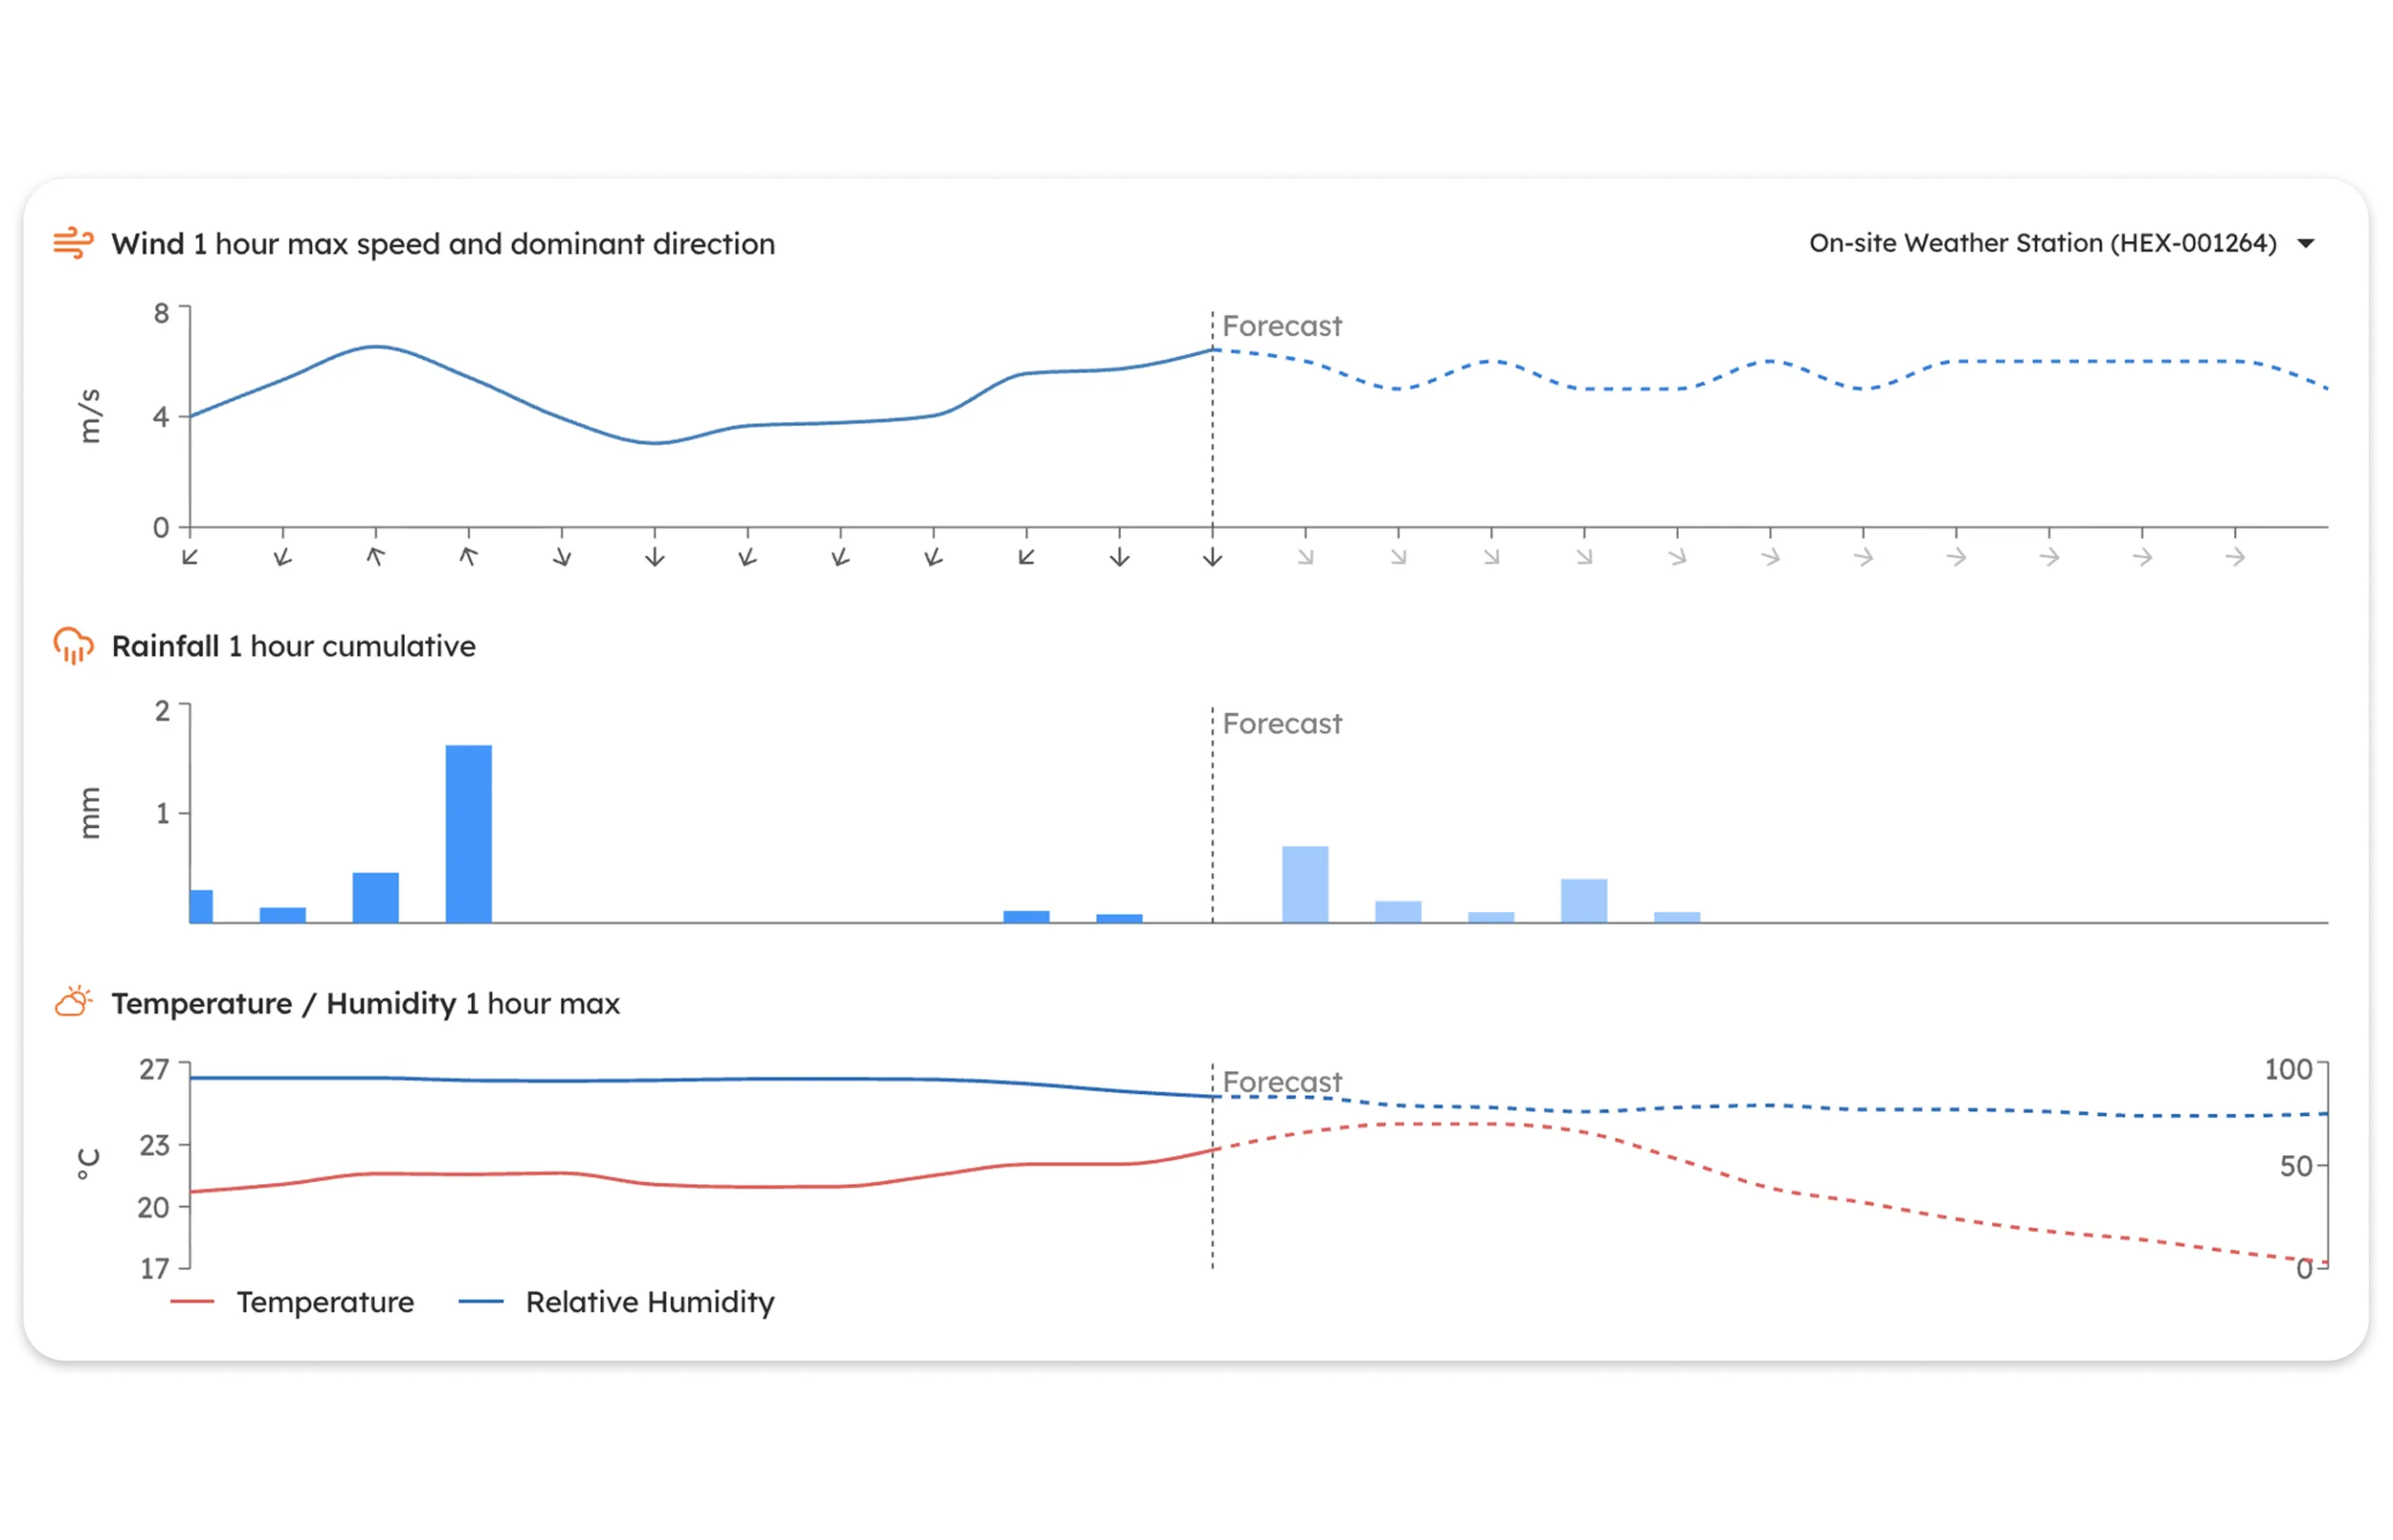
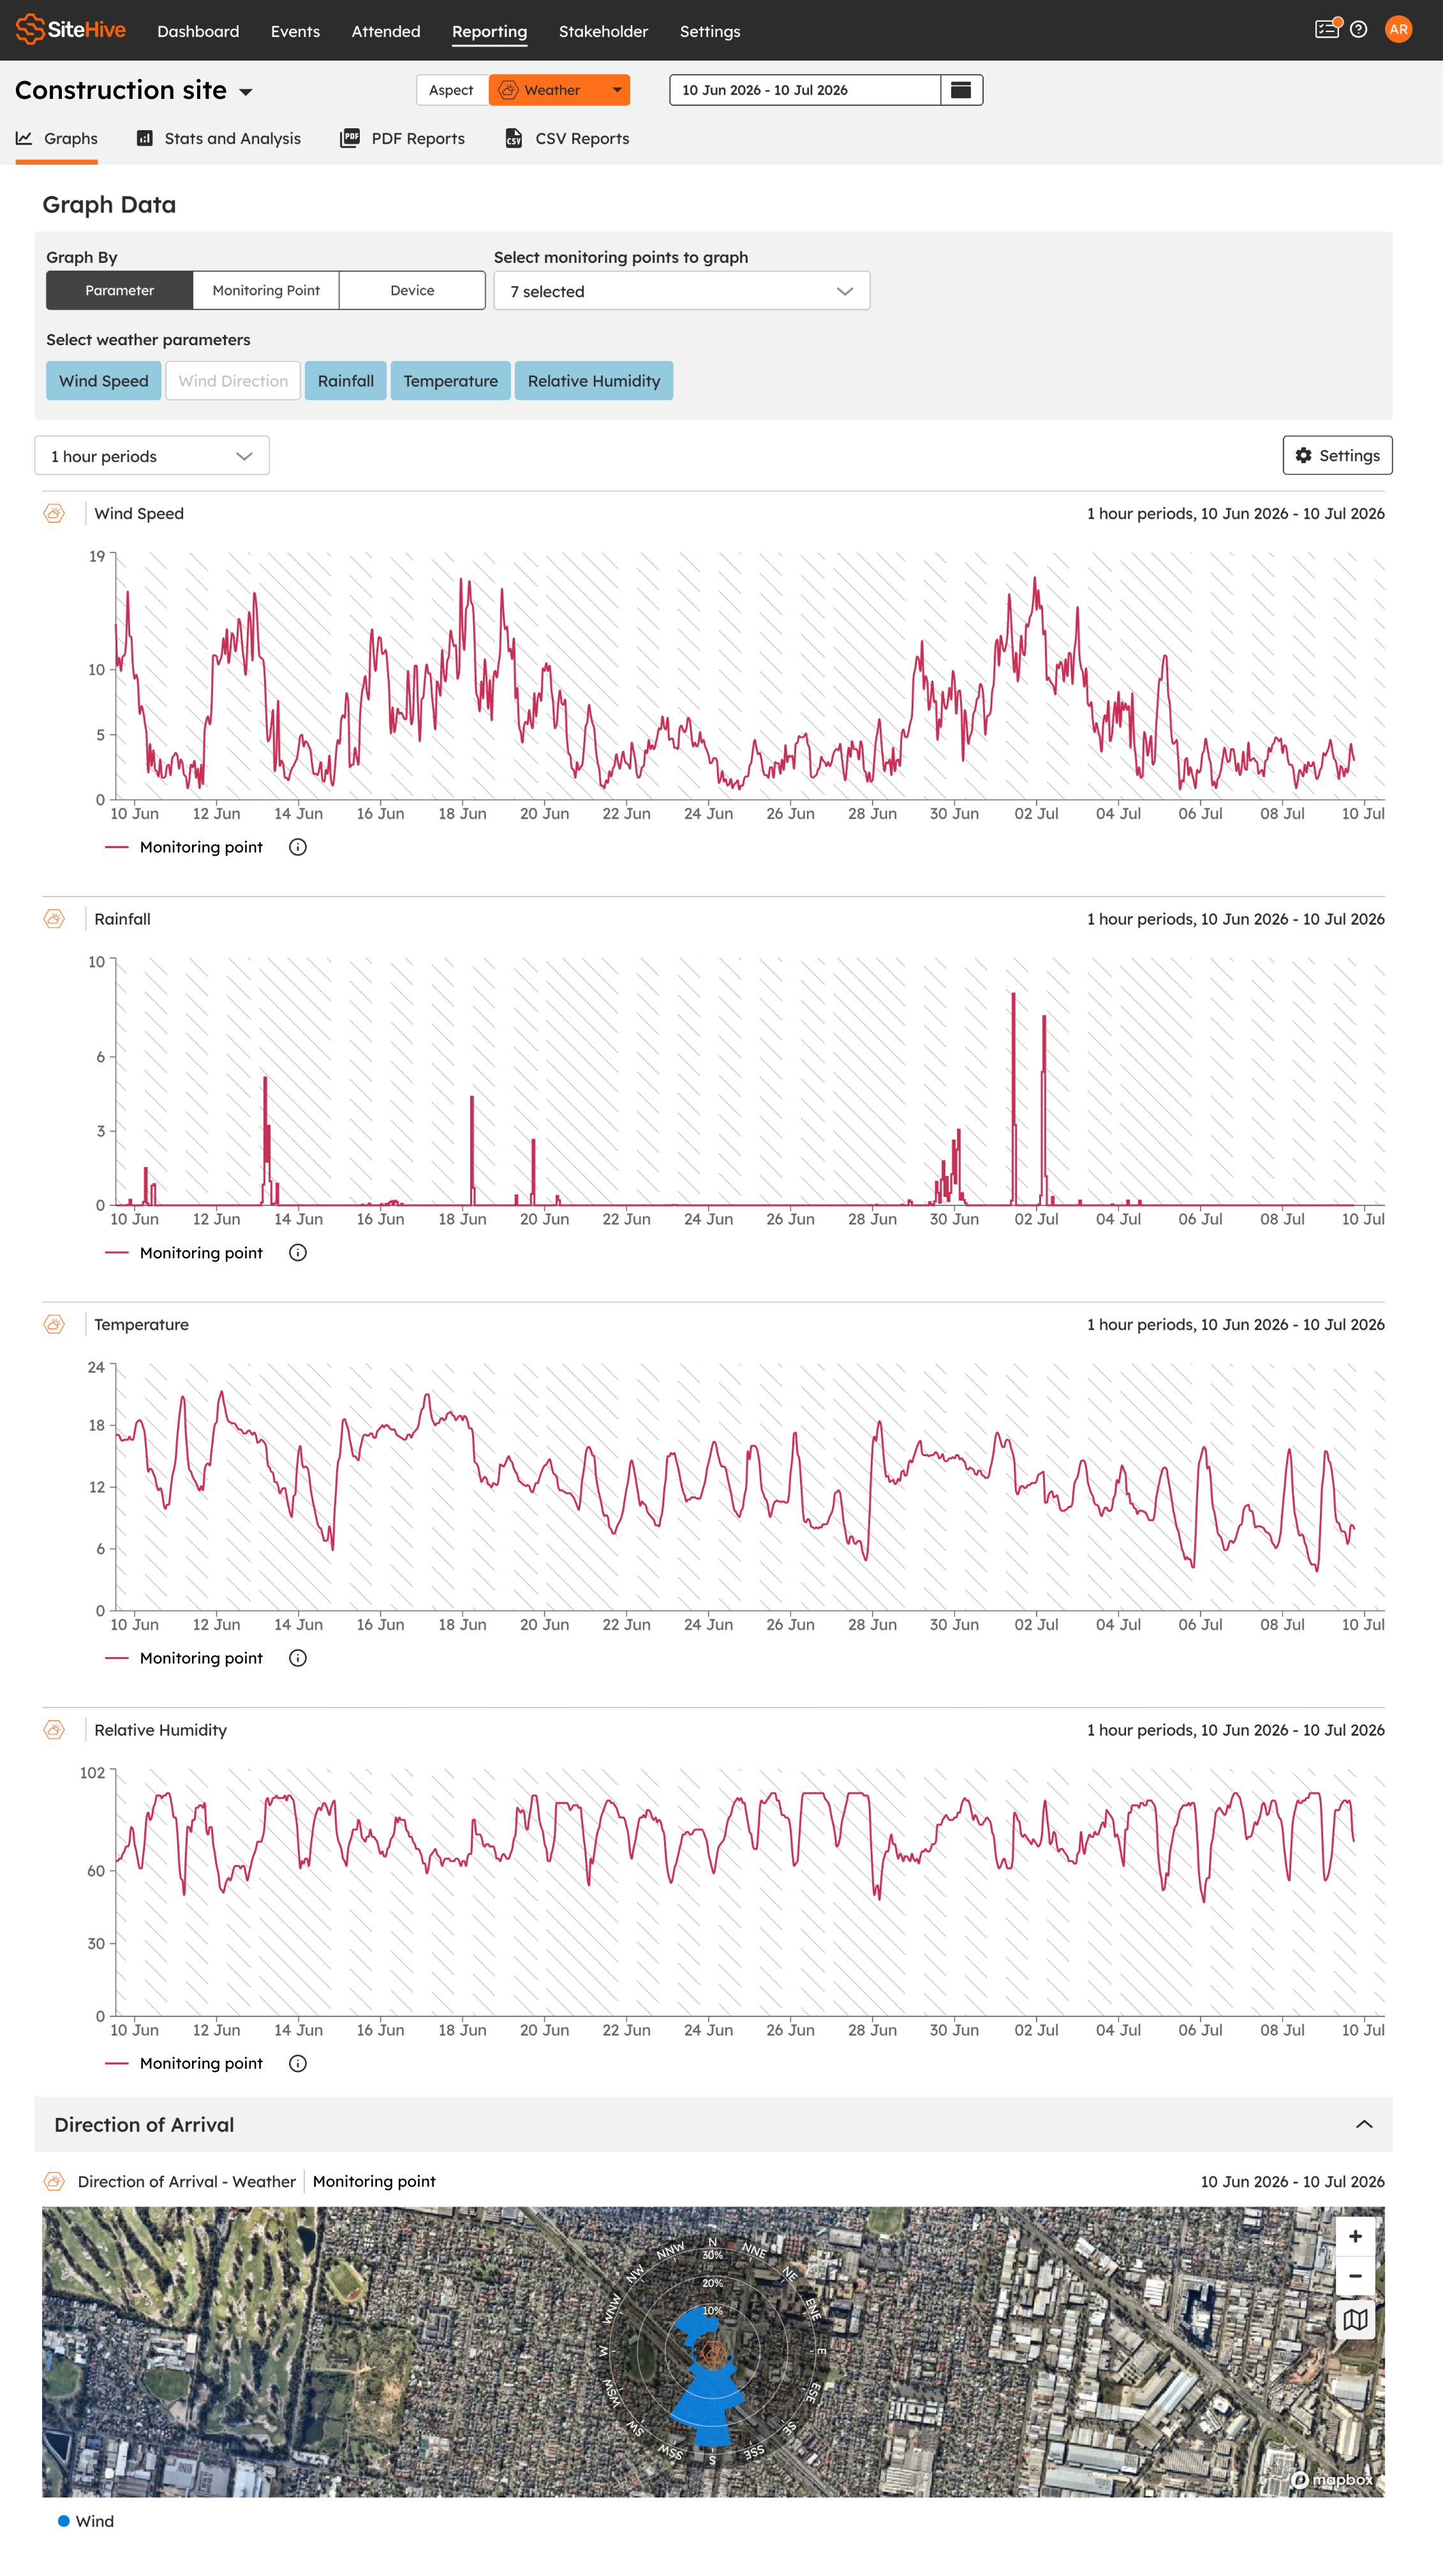
Select the Weather aspect to see graphs per monitoring point for wind, rainfall, temperature and humidity.
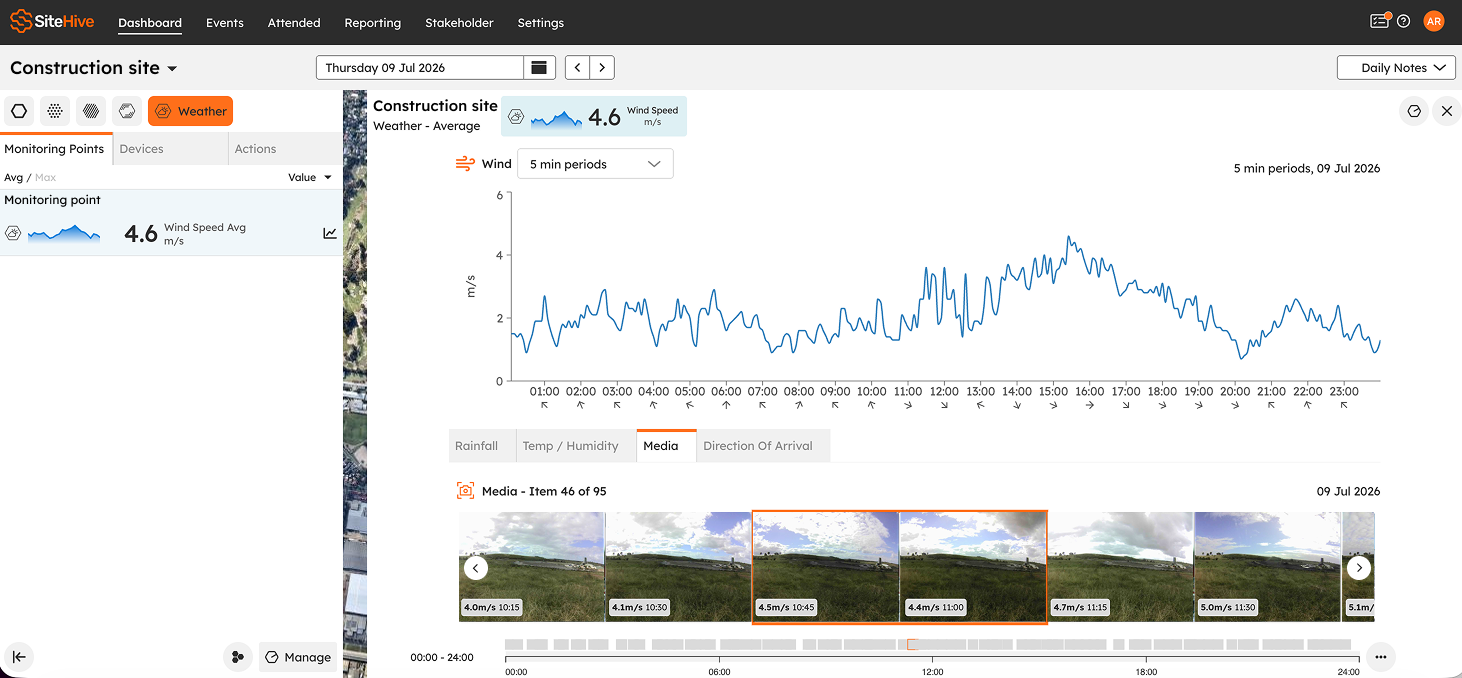
Timelapse images appear in the media section, so you can scrub through the day and see conditions for yourself.
Graphs
In Reporting > Graphs, weather is available as a primary aspect, so you can explore trends over time and compare multiple devices. On your noise and dust graphs, weather-affected periods are highlighted automatically based on your criteria.
Stats & Analysis
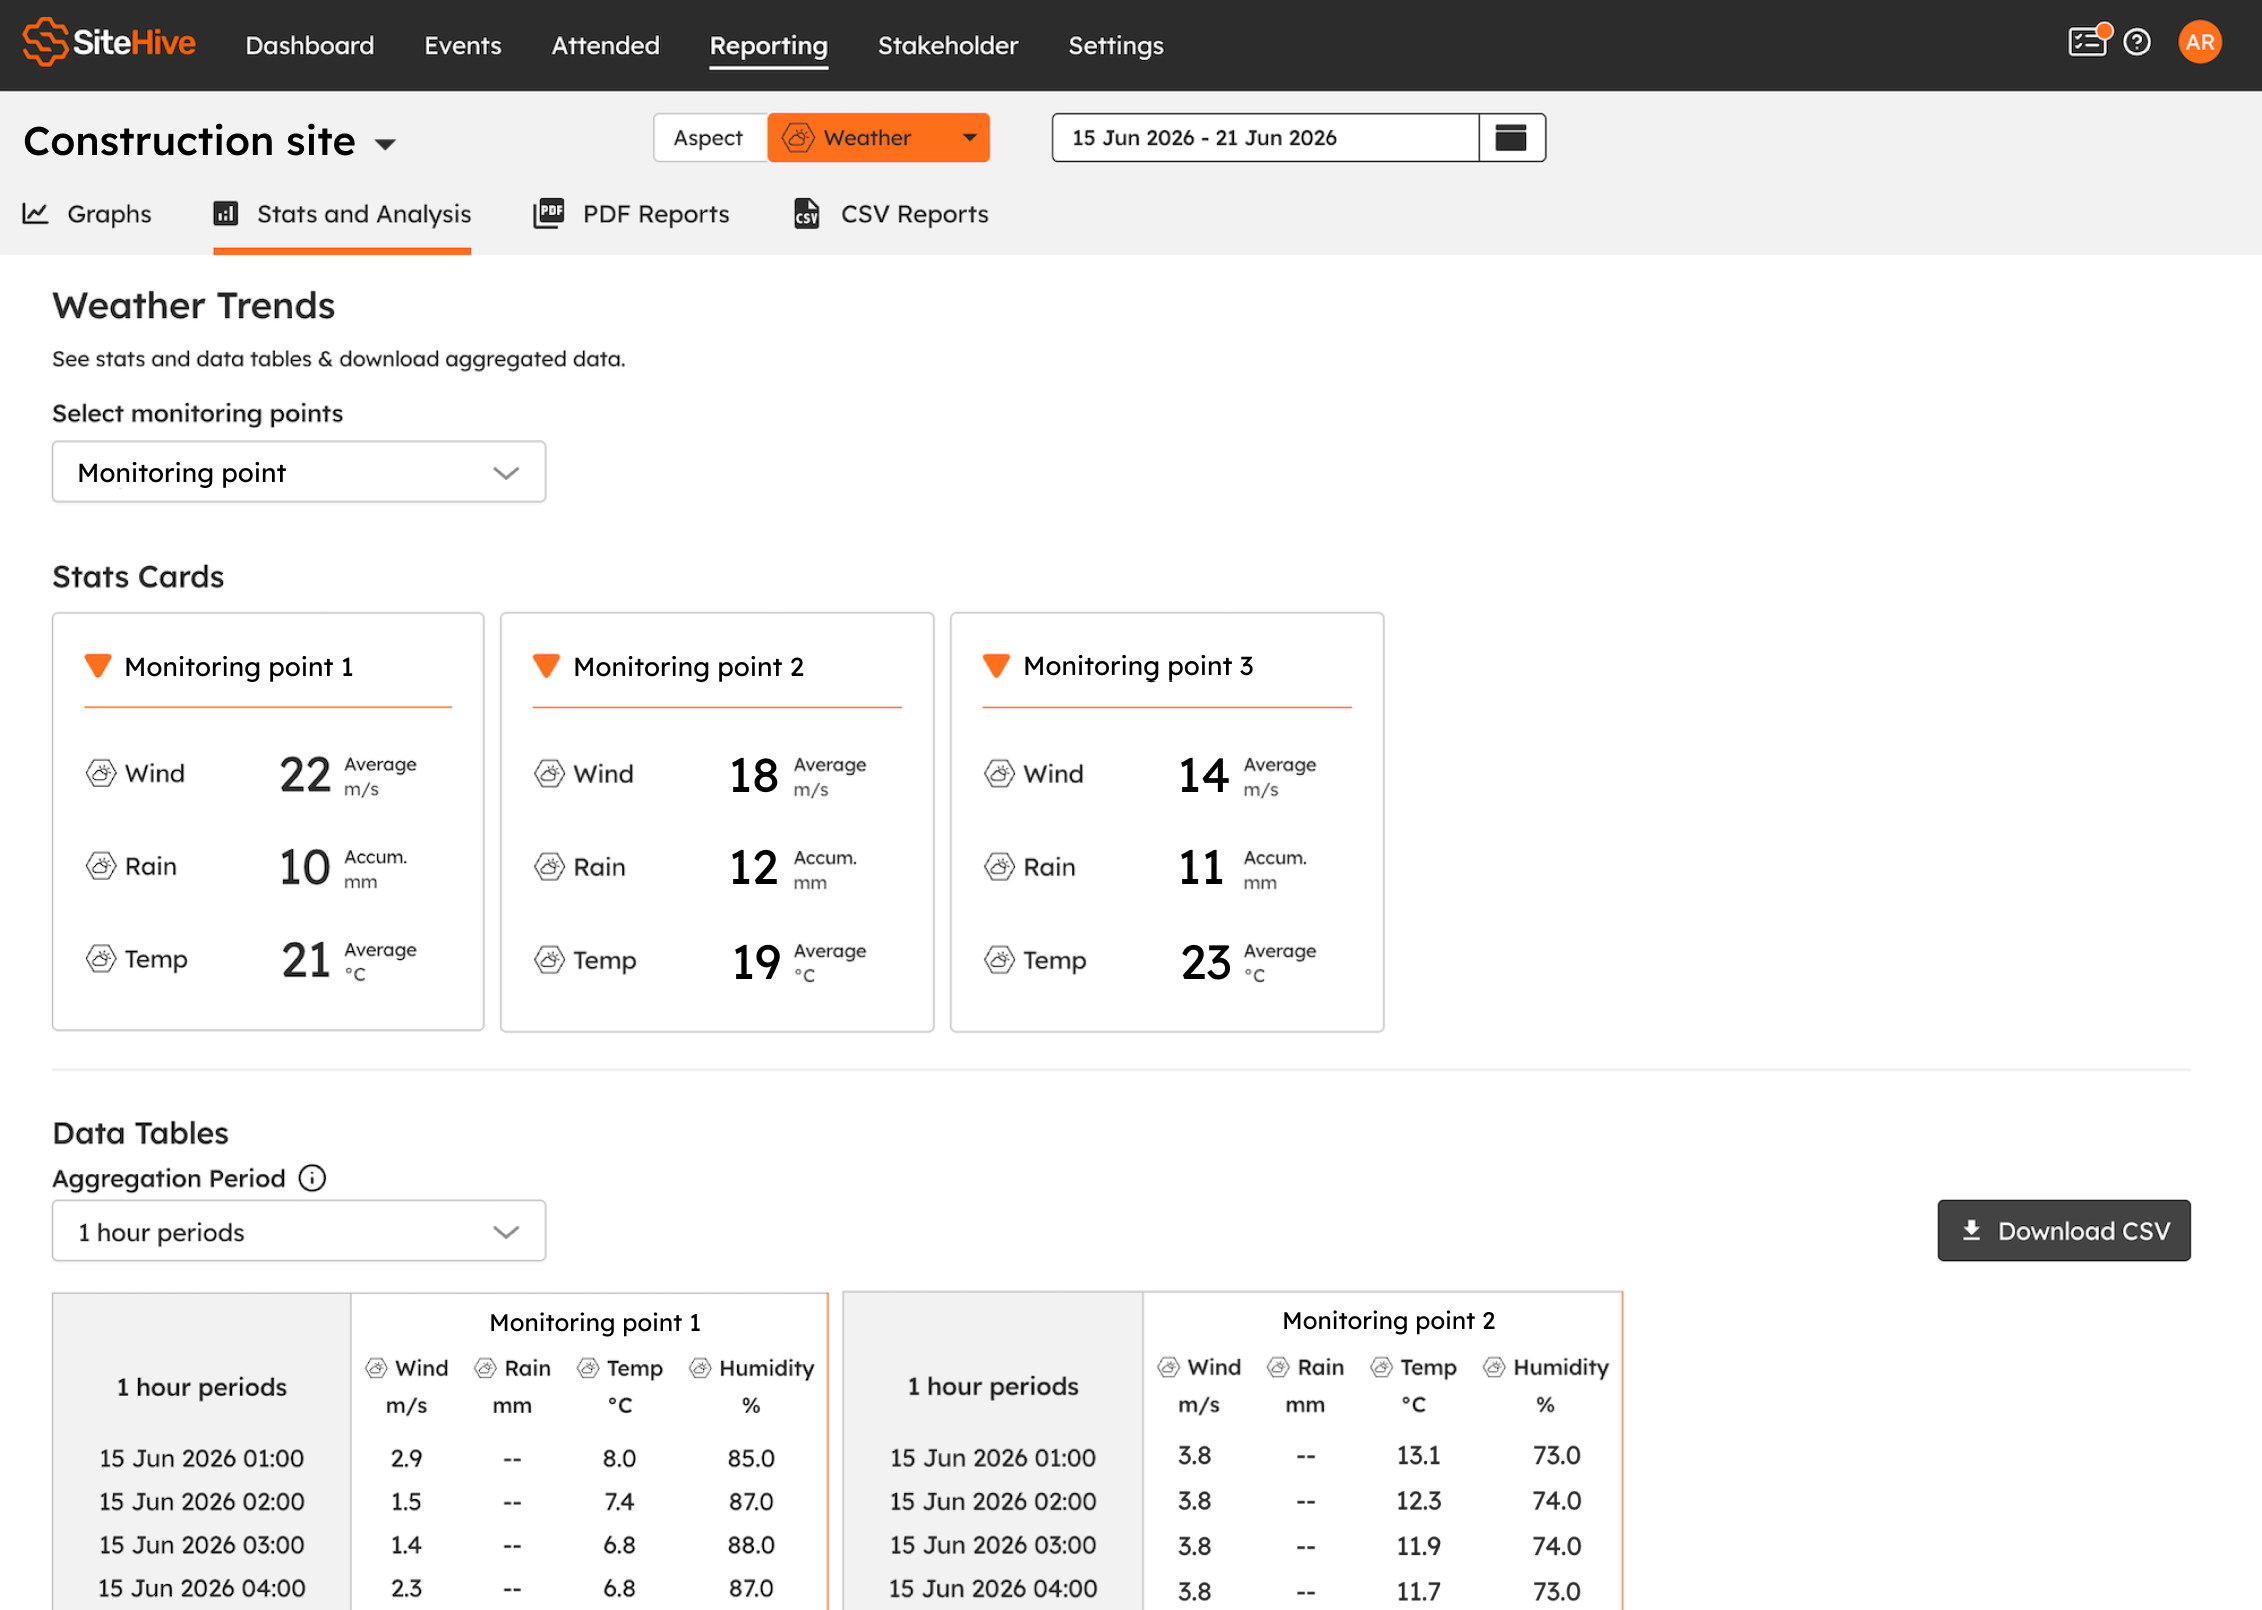
Stats & Analysis gives you stats cards showing averages for wind, rain and temperature over your selected period, plus aggregated data tables you can download.
PDF and CSV reports
Generate a formatted PDF report with graphs for wind speed, wind direction, rainfall, temperature and humidity. CSV exports give you the raw data for all parameters, with timestamps in your site's timezone, ready to compare with public weather sources or analyse further.
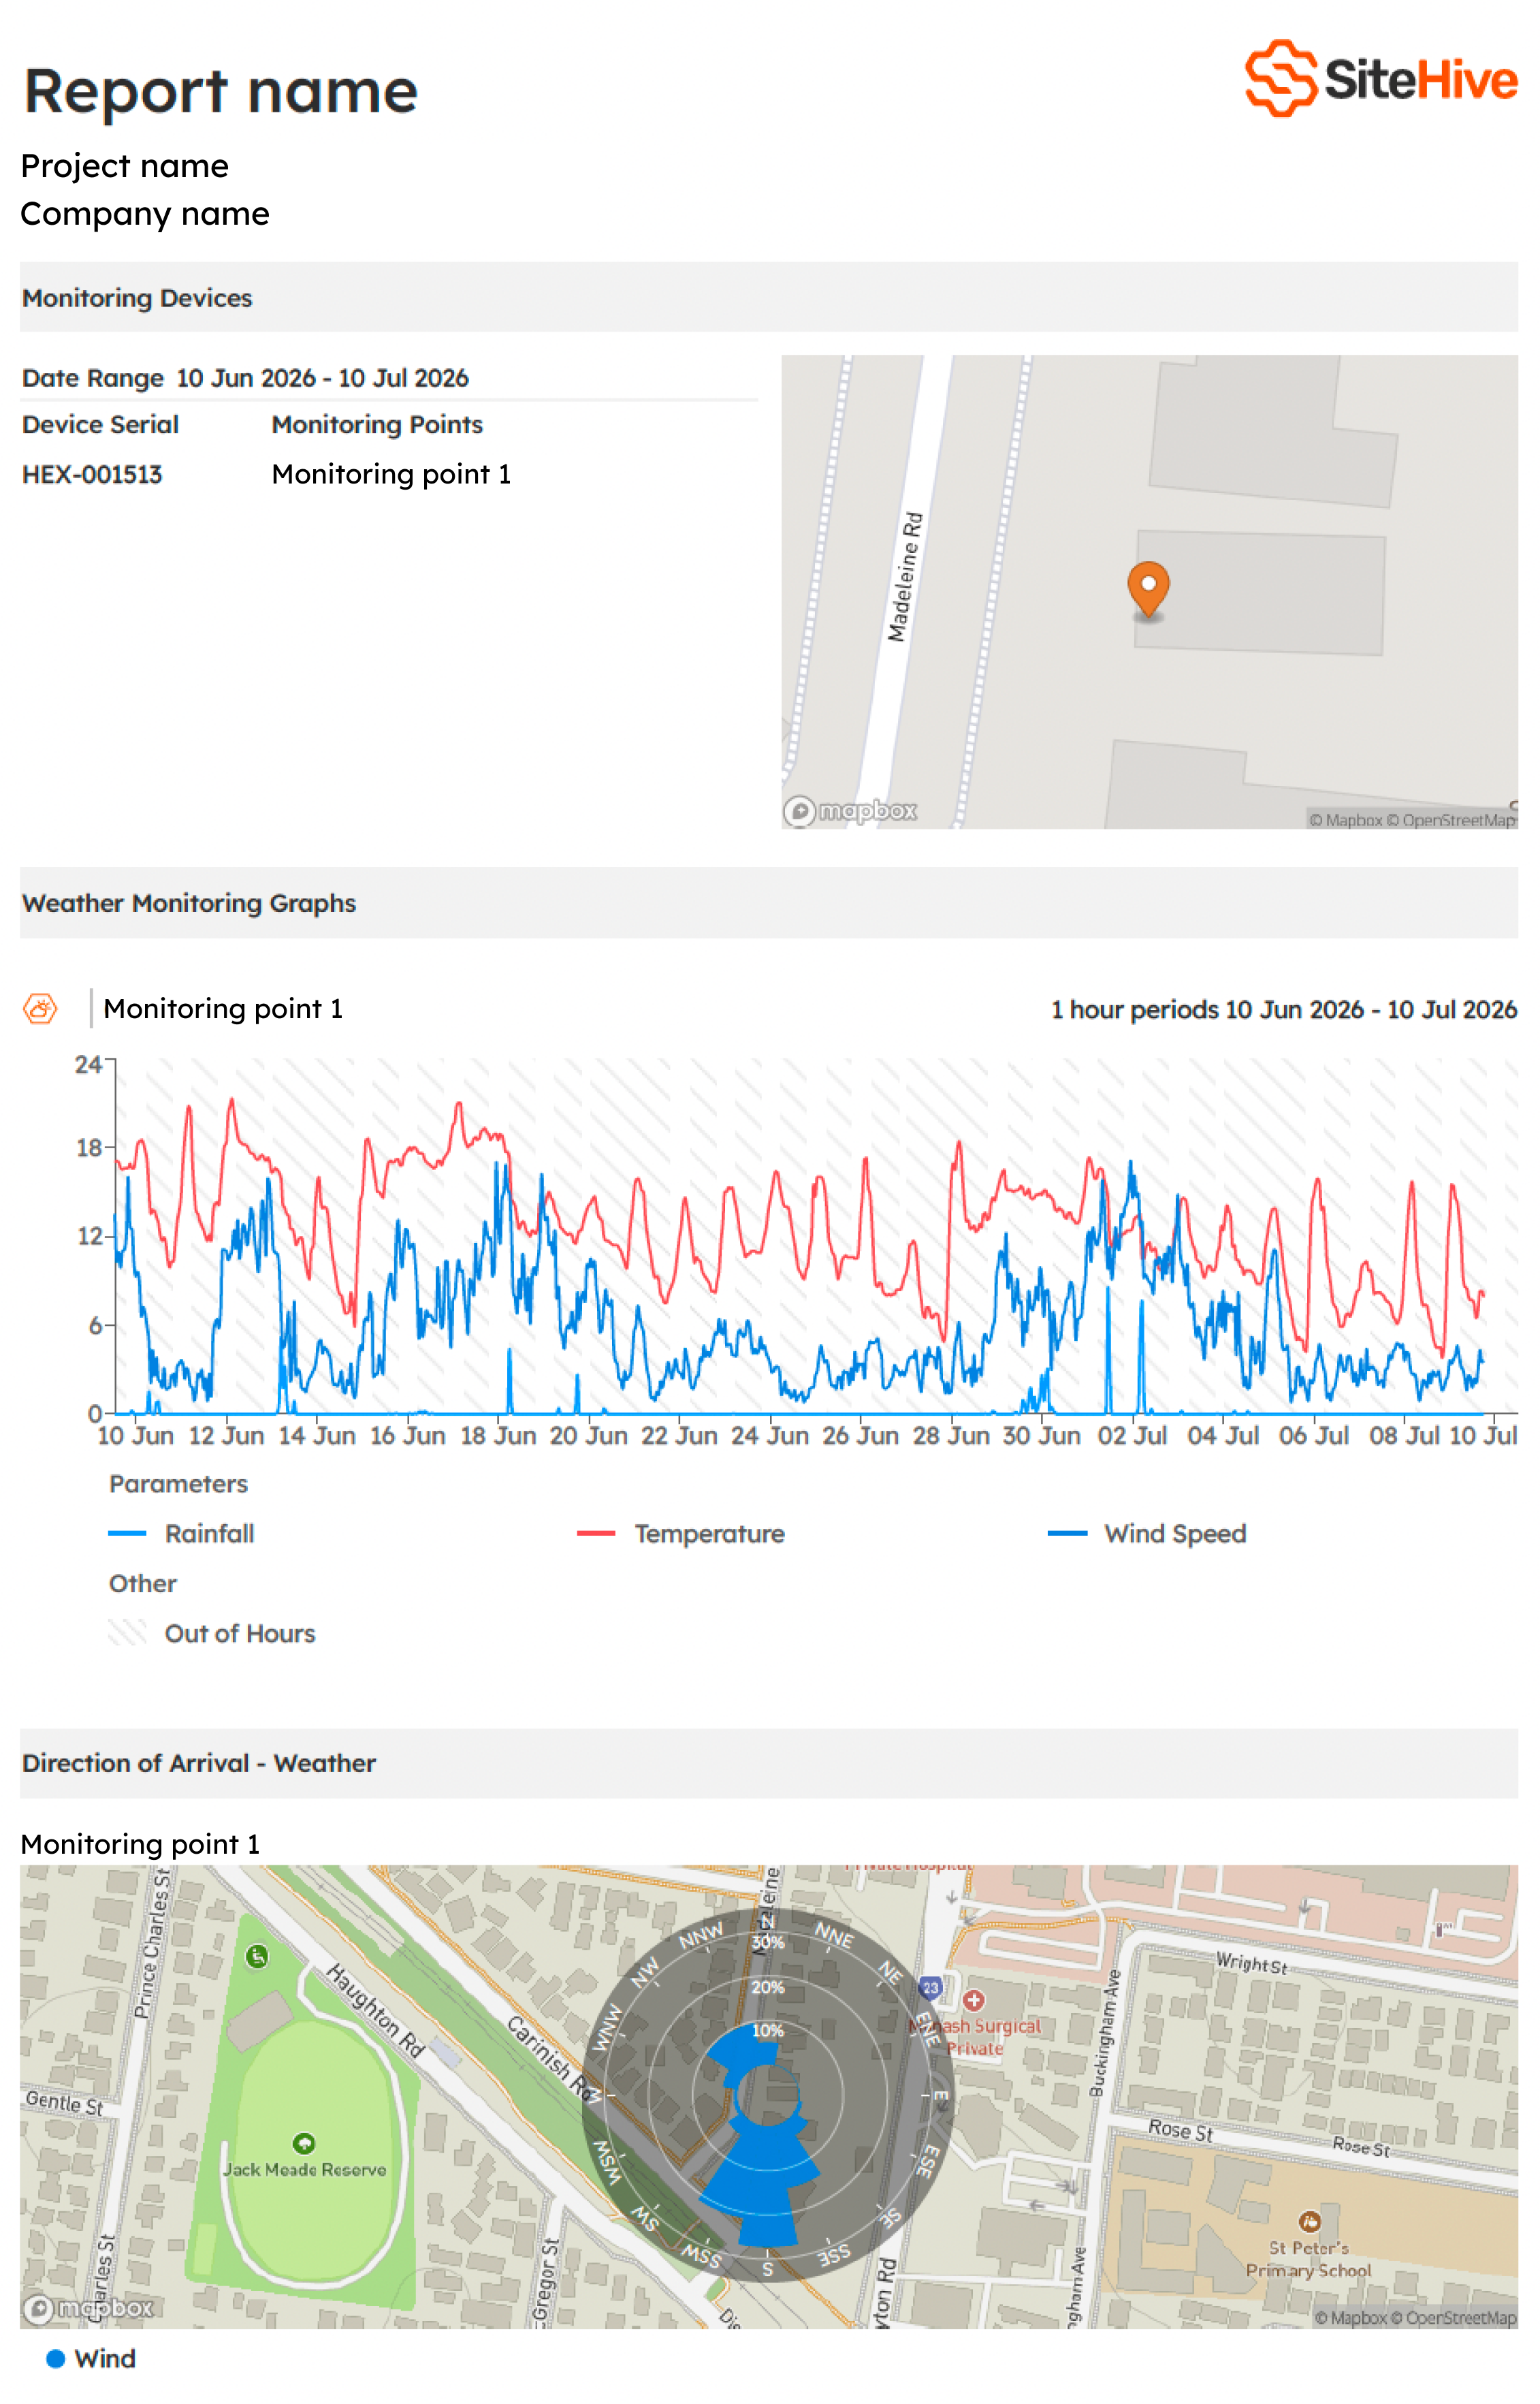
Coming soon: wind rose visualisation in PDF reports.
Why it matters
Plan and sequence works with confidence, using hyperlocal data and a forecast for your exact site rather than the nearest public station.
Keep your team safe by acting early on wind, rain and heat risks, with alerts for crane operations, surface water inspections and heat stress.
Explain environmental outcomes, such as the impact of wind direction on dust readings, with weather and environmental data in one place.
Support compliance and claims with an accurate historical record of on-site conditions, exportable in PDF and CSV.