
The Manage window
The Manage window is where you look after a site once it is running: every Monitoring Point and every device in one place, with their rules, media triggers, power, signal, calibration details and the actions that change how a device is deployed. This page is a map of what is in it and where.
Where to find it
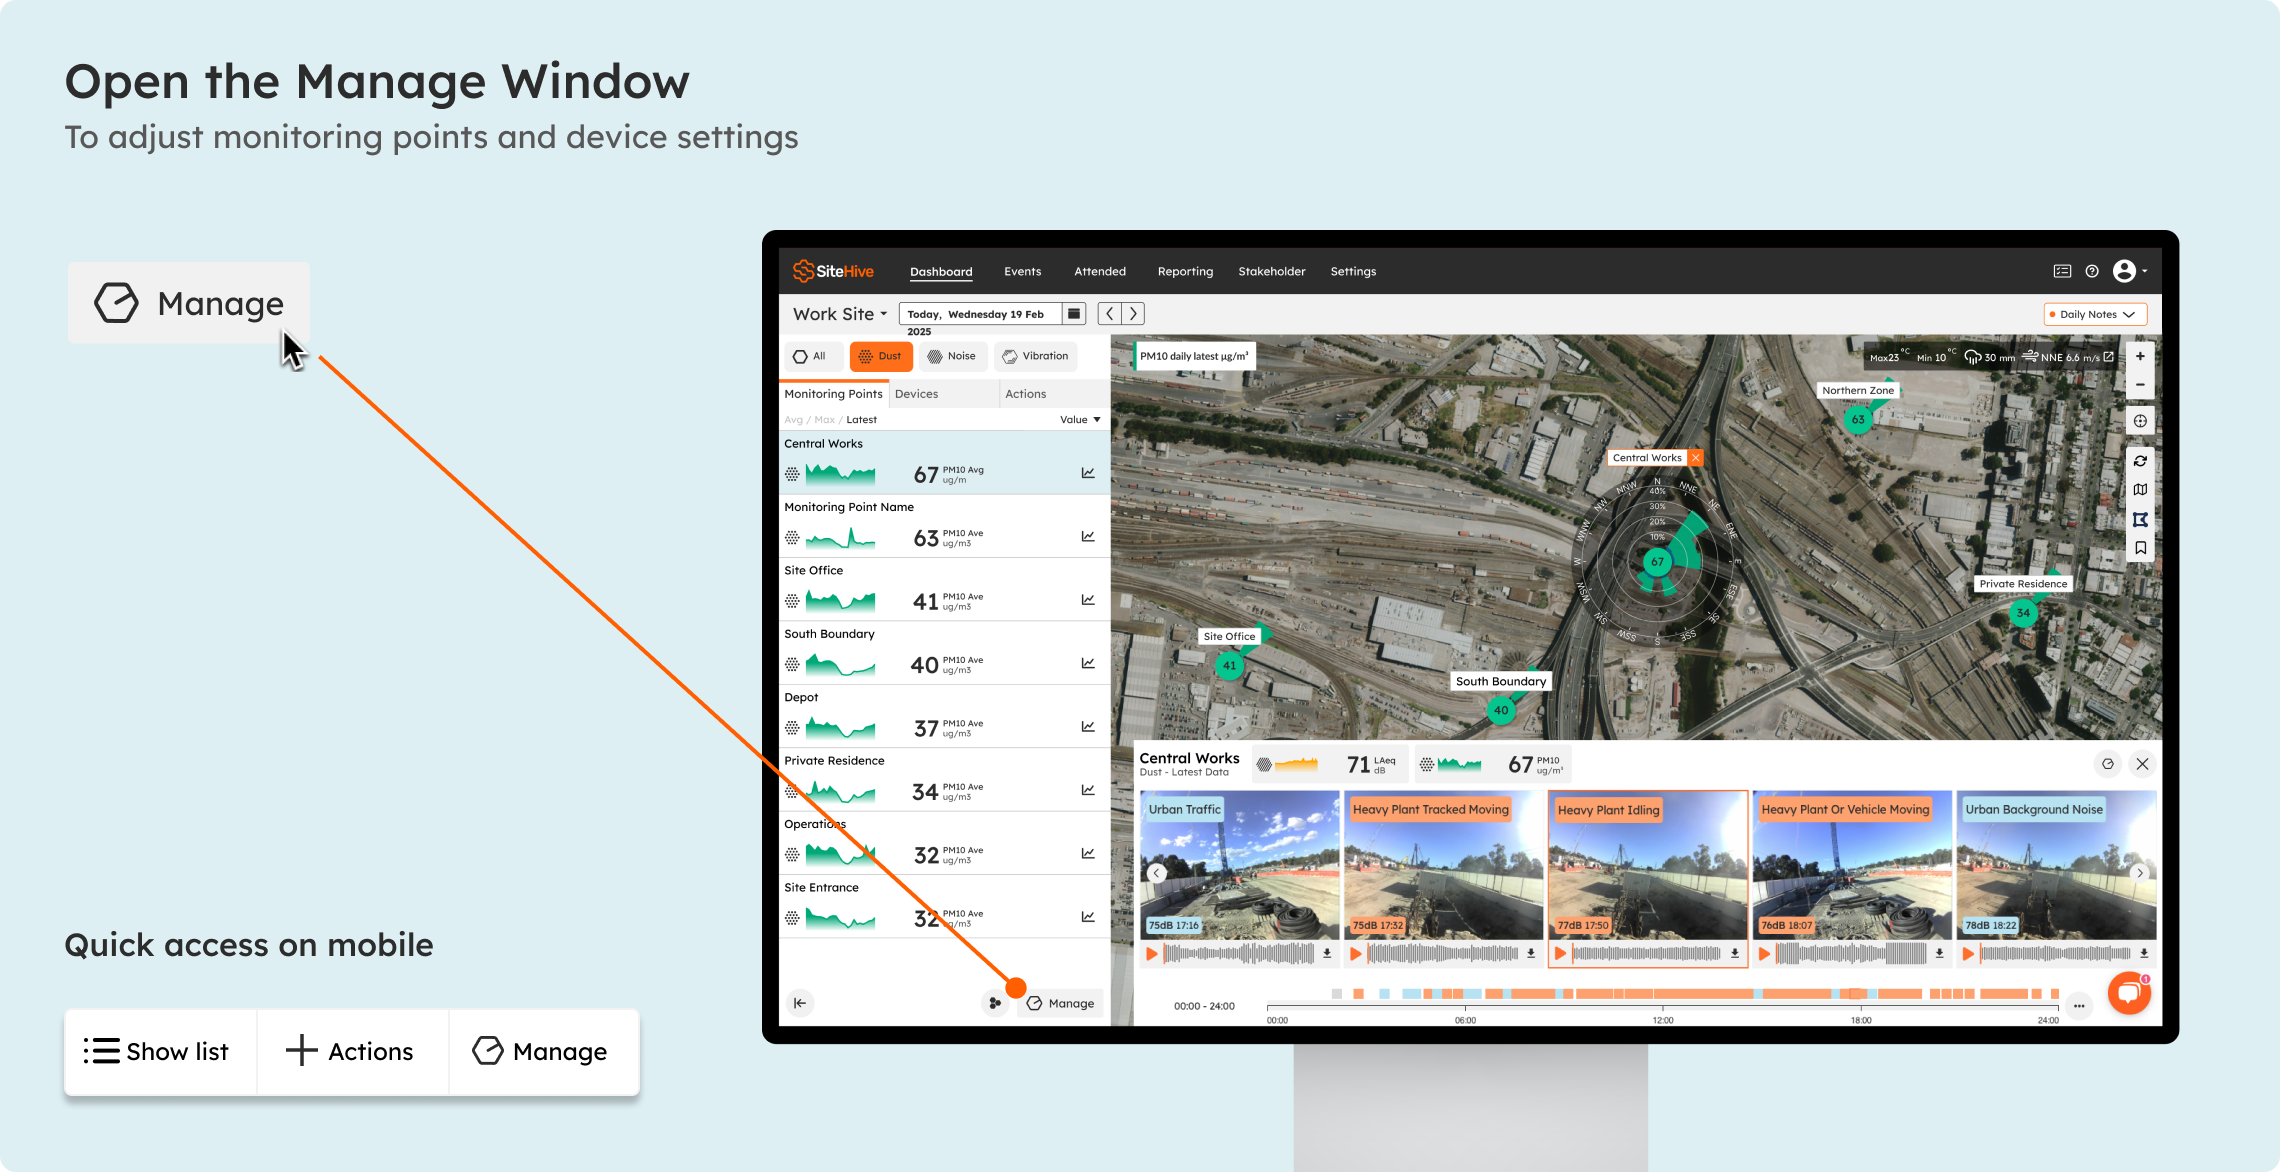
On the Dashboard, select a Monitoring Point or a device in the side panel and click Manage at the bottom of the panel.
In the Devices tab of the side panel, click the up arrow next to a device name, the Manage button, or the Manage symbol in the top right of the media reel.
In Settings > Devices & Monitoring Points, click Manage on any row.
The window has two views, Monitoring Point and Device, and you can switch between them without closing it.
The Monitoring Point view
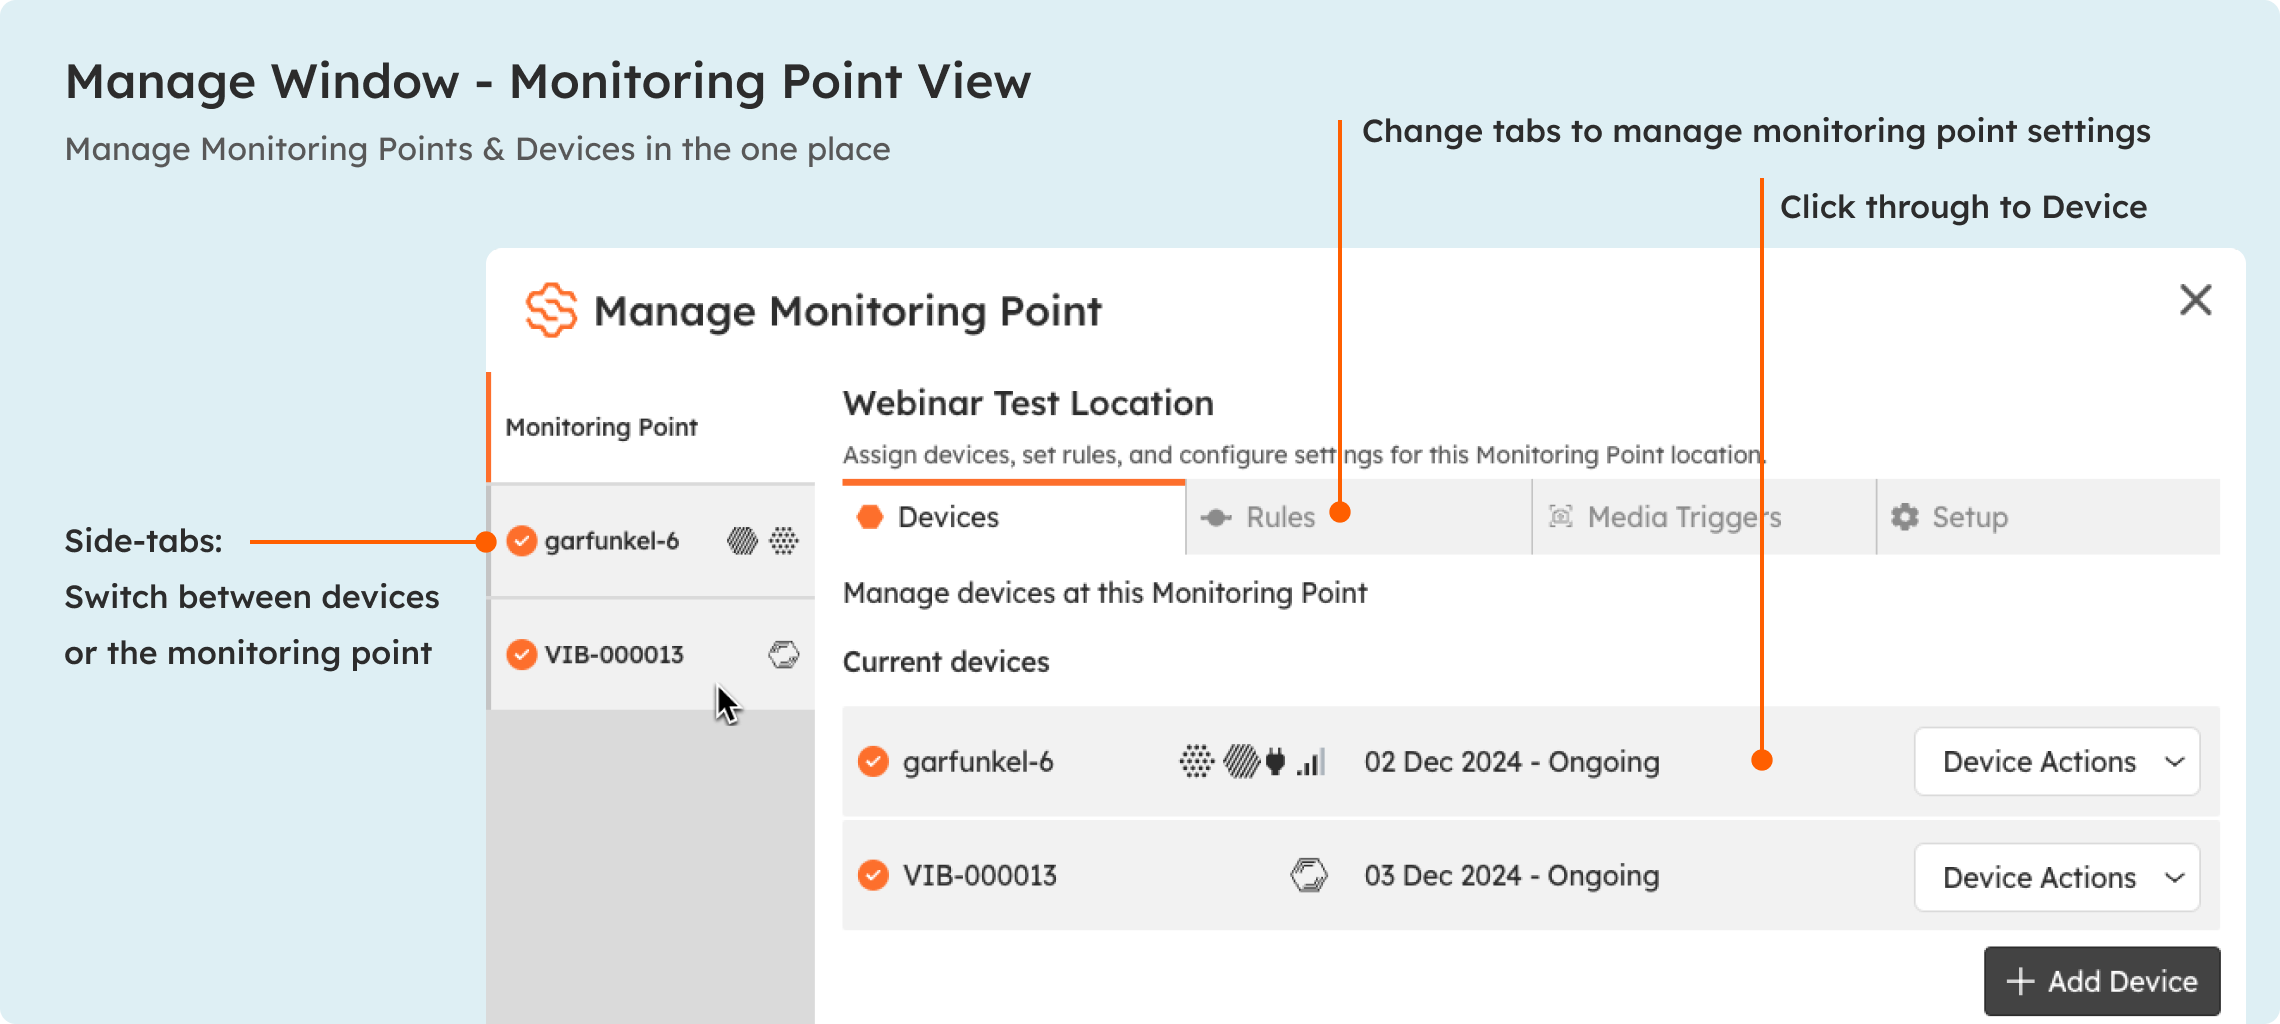
Select a Monitoring Point to see the devices assigned to that location, and three tabs:
Rules: the thresholds and notifications that apply at this point. Set up and edit them here or in Settings > Rules & Notifications.
Media Triggers: the LAmax level that captures photos and audio at this point (default 75 dB). See Set up media triggers.
Setup: the point's details and position.
The Device view
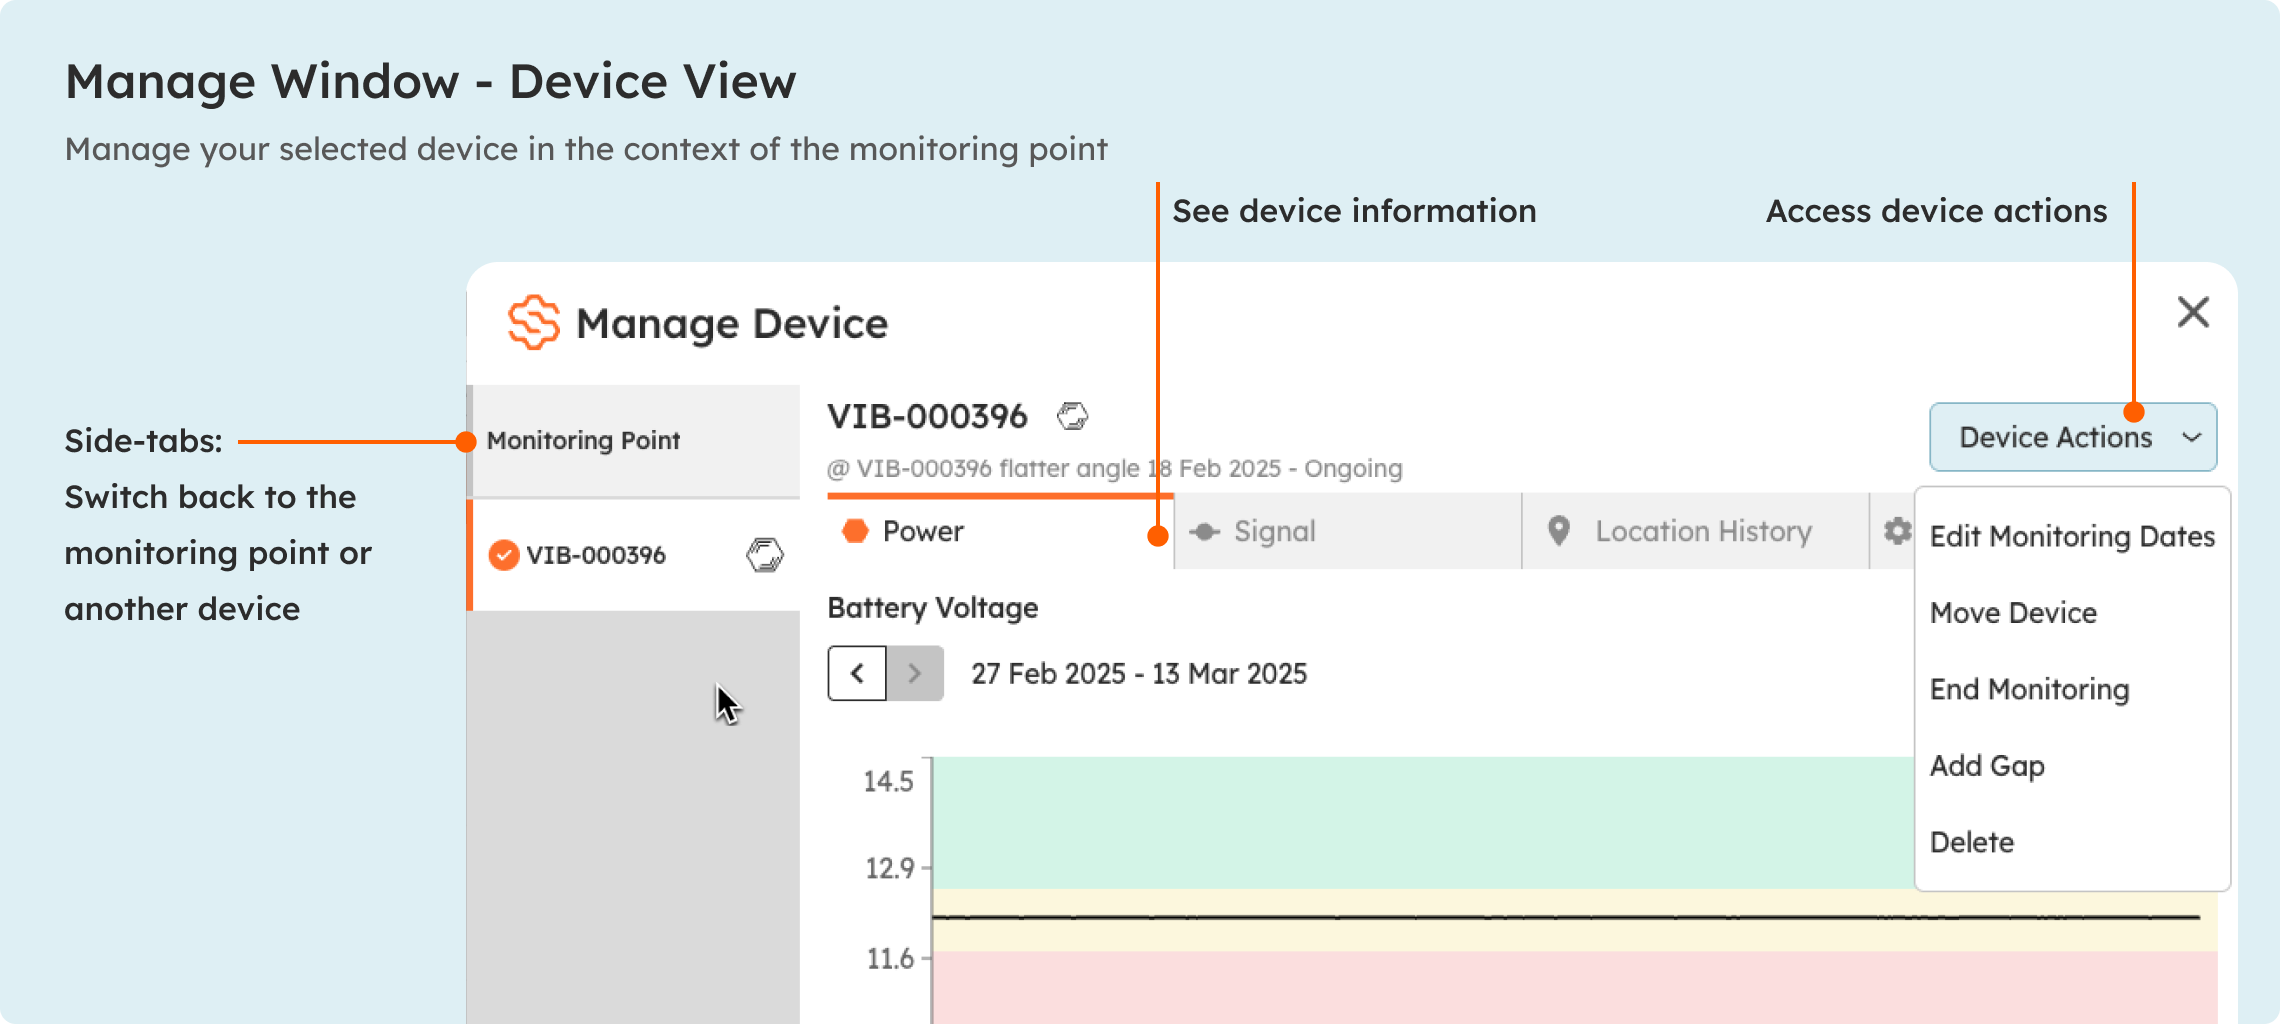
Select a device, from the side tabs or the Devices tab, to see its information and health:
Power: the battery level. Below 25% triggers the low-battery alert at 8 am if you have it turned on.
Signal: connectivity. A healthy battery with a device offline usually means weak signal.
Details: the calibration date and calibration due date, and the calibration certificate to view or download. You can also attach your own documents to a device here, such as deployment photos or maintenance logs. See Assured calibration and certificates.
Device actions: the dropdown on the device line. Edit monitoring dates, edit orientation, move the device to another Monitoring Point, or end monitoring. Each one is explained in Edit, end or move a device.
💡 Checking several devices? Settings > Devices & Monitoring Points lists them all, and its Download certificates button gets every calibration certificate in one go.
What the Manage window is not for
Adding a brand new device to the site is done with Easy Setup, from the Actions tab of the side panel. Easy Setup creates the Monitoring Point and assigns the device; the Manage window is for everything after that.
What's next
Edit, end or move a device (the Device actions, step by step)
Set up rules and notifications (thresholds per Monitoring Point, alerts by email or SMS)
Device offline? If a device goes offline (read the Power and Signal tabs first)