
Vibration Criterion (VC) curves
Vibration Criterion (VC) curves are used to monitor vibration impact on sensitive equipment. SiteHive's VC curves allow you to monitor compliance in real-time with automatic alerts, Dashboard visualisation and data export built in.
What are VC curves?
VC curves (Vibration Criterion curves) are an internationally recognised set of guidelines for assessing the impact of vibration on sensitive equipment and spaces such as hospital operating theatres, university research labs, electron microscopes and data centre equipment.
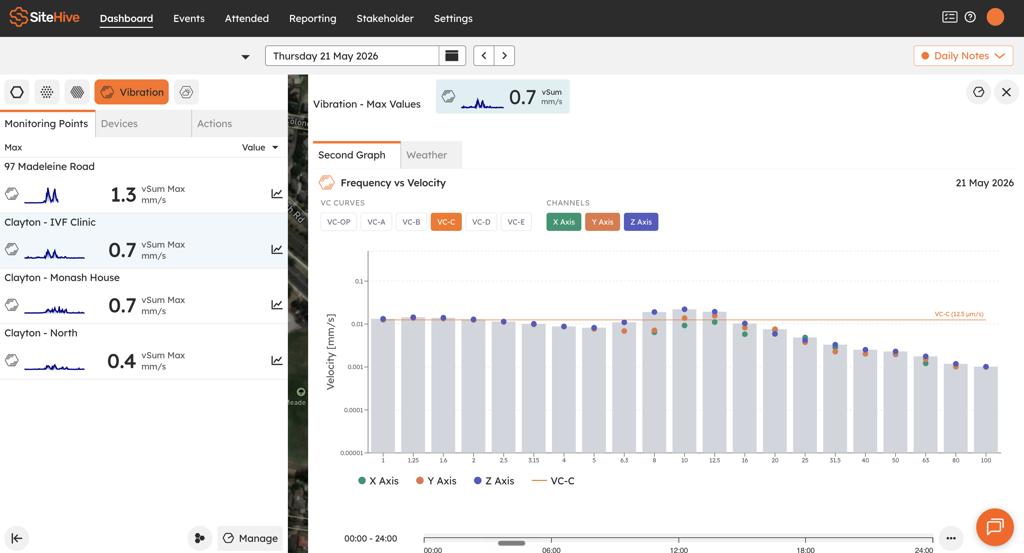
The VC curves compare vibration, measured as root-mean-square (RMS) velocity across 1/3 octave frequency bands from 1 Hz to 100 Hz, against the relevant threshold, depending on the required sensitivity.
The further along the alphabet, the more stringent the limit: VC-C is stricter than VC-A.
VC-A: 50 µm/s. Standard laboratories, offices.
VC-B: 25 µm/s. Hospital operating theatres, sensitive labs.
VC-C: 12.5 µm/s. Electron microscopes, research equipment.
ℹ️ SiteHive currently supports monitoring against VC-OP, VC-A, VC-B and VC-C. Your project specification or environmental management plan will confirm which VC curve applies to your site.
SiteHive VC Curves
The SiteHive Hexanode Vibration device measures RMS velocity across 1/3 octave bands and uploads data continuously to the SiteHive Enviro Pro Dashboard, with no manual data collection.
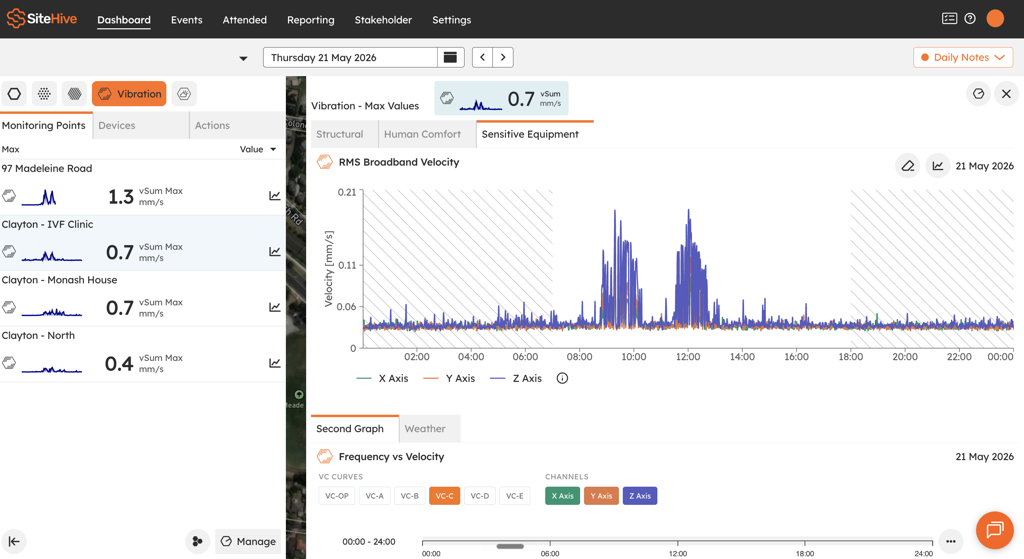
Dashboard visualisation - view broadband RMS velocity over time plotted directly against your selected VC curve threshold, all in one place.
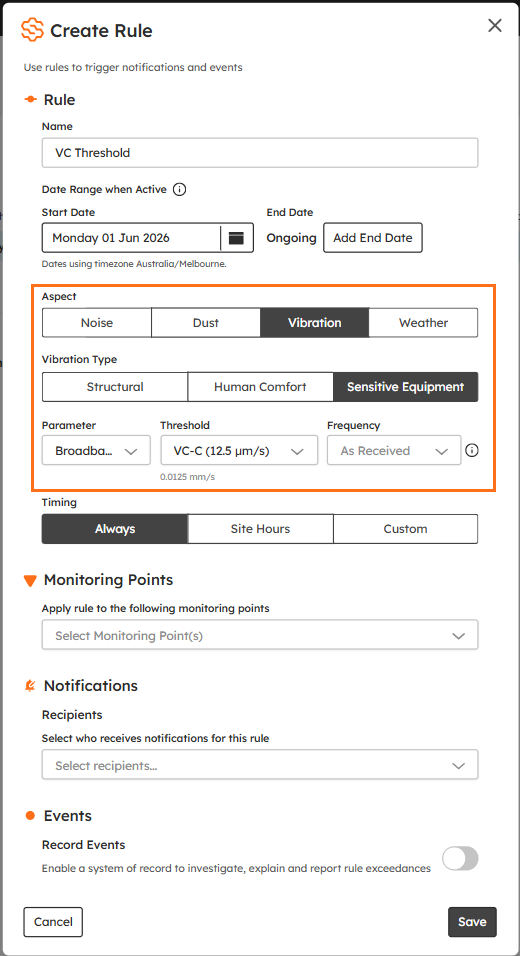
Threshold alerts - set VC threshold and receive a notification within one minute of an exceedance, by email or SMS.
Events and investigation - Every exceedance is logged automatically as an event, with a timestamp, peak level and waveform detail, so you can investigate causes and demonstrate compliance management.
Download CSV reports - containing broadband and 1/3 octave band data for any period.
How it works
On the device
The SiteHive Hexanode Vibration device records high-frequency raw vibration data.
It calculates RMS velocity across 1/3 octave frequency bands from 1 Hz to 100 Hz.
Data is integrated over 1-minute periods (with 1-second resolution) and uploaded to the cloud.
In SiteHive Enviro Pro
Your broadband RMS level is displayed on the Dashboard, plotted against your chosen VC curve threshold for instant compliance assessment.
Alerts fire automatically when the broadband level exceeds your configured threshold.
💡 The SiteHive Hexanode measures to VC-C from 2 Hz upward, so it covers the 2 to 100 Hz portion of the 1 to 100 Hz VC band. That covers the compliance requirements of the vast majority of construction projects near sensitive environments.
Data display and reporting
Setting a threshold
To be notified when the vibration level exceeds your selected threshold, set up a rule in Settings > Rules & Notifications: choose the Vibration aspect, the Sensitive Equipment type and your VC curve as the threshold. Steps: Set up rules and notifications.
CSV export
Download your data from the Reporting page (Export a CSV report). The export includes broadband RMS velocity over time and 1/3 octave band data for the selected period.
PDF reporting: periodic PDF reports for VC curves are coming soon. Use the CSV export in the meantime.
When should I use VC curve monitoring?
VC curve monitoring is typically used when construction or industrial activity happens near vibration-sensitive equipment. Common applications include:
Hospitals with MRI, CT or imaging equipment
Research laboratories using microscopes or precision instruments
Semiconductor manufacturing facilities
Data centres and sensitive electronic environments
Universities and research facilities
If your project specification, environmental management plan or client requirements reference VC curves, this feature assesses compliance against the nominated VC curve threshold.
What's next
SiteHive Vibration: what it measures and how (the device, and PPV and VDV for structures and people)
Set up rules and notifications (the VC threshold rule, step by step)
Export a CSV report (broadband and 1/3 octave data for any period)