
Events: investigate an exceedance
Explore the functionality of Events, a SiteHive Enviro Pro feature that enables users to track, analyse, and gain valuable insights into on-site exceedances.
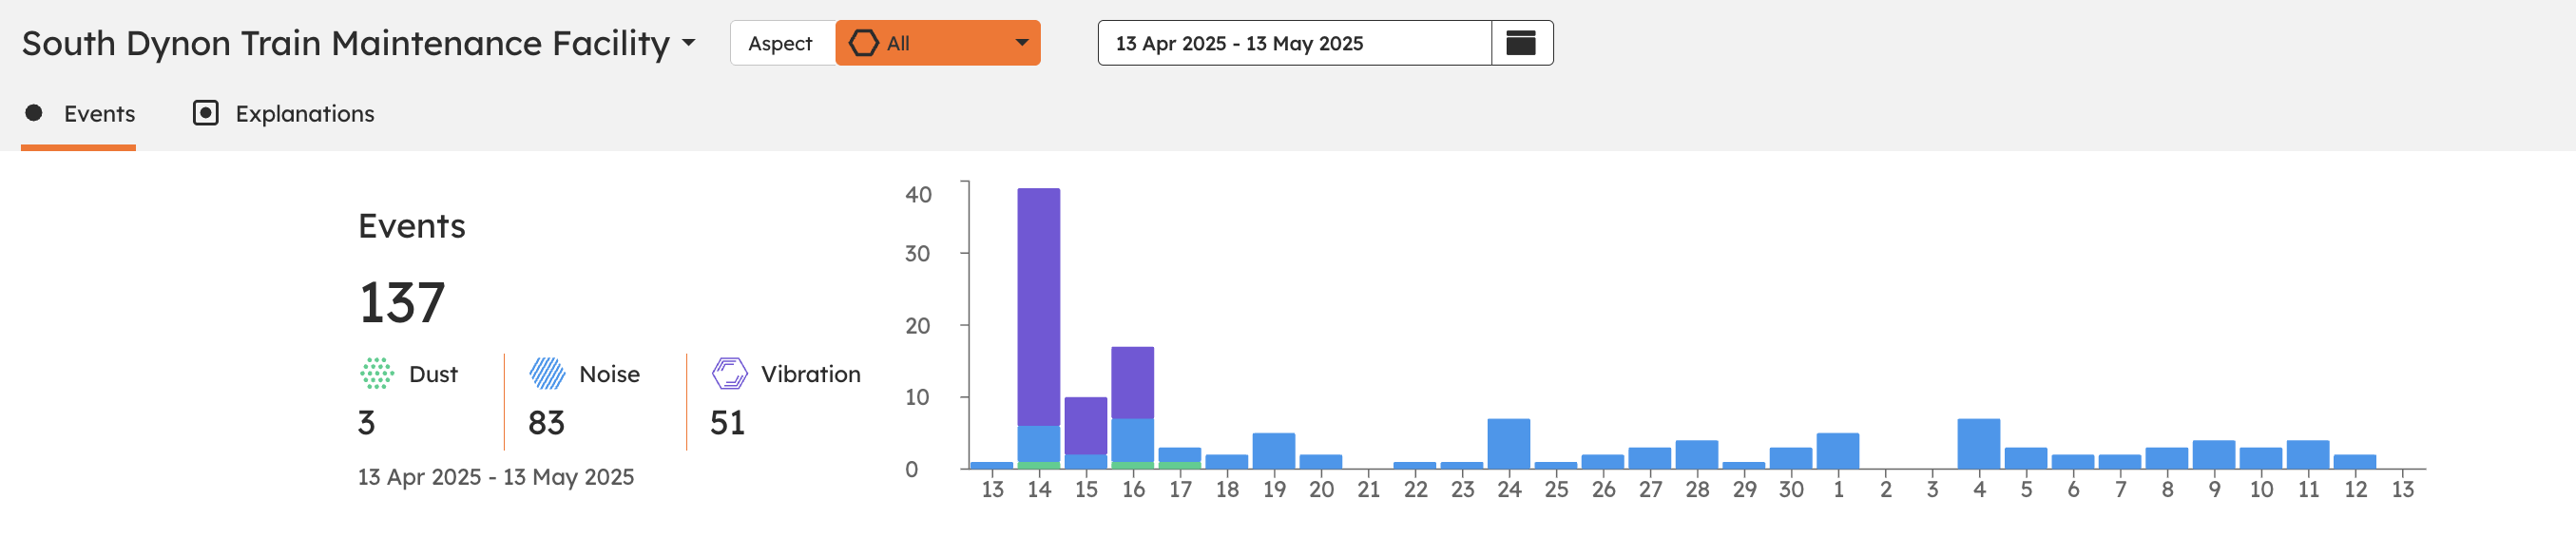
Where to set up events
Events lets you record, investigate and explain exceedances that happen on site. Events are generated by rules, so setup starts on the Rules & Notifications page.

Log in to SiteHive Enviro, then:
Navigate to the top menu bar and click Settings.
Look underneath your site name to the second menu and click Rules & Notifications.
Click Create Rule.
Rules
Events are generated by rules. A rule is based on an aspect (e.g. Noise) and a parameter (e.g. sound level), a threshold (e.g. 65 dB) and a time of day (e.g. 7am to 6pm).
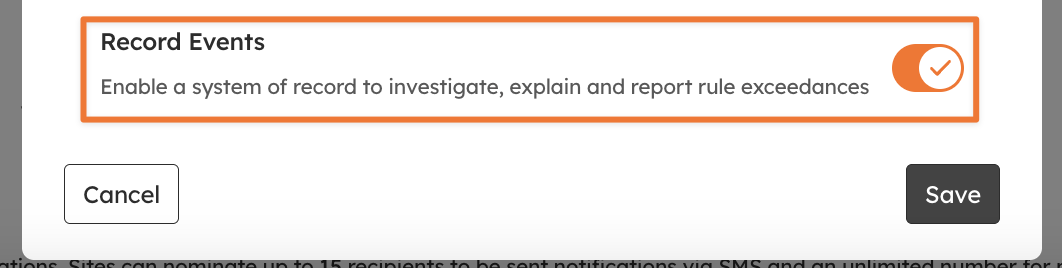
When creating a rule, you can specify whether the rule generates an Event, with the Record Events toggle.
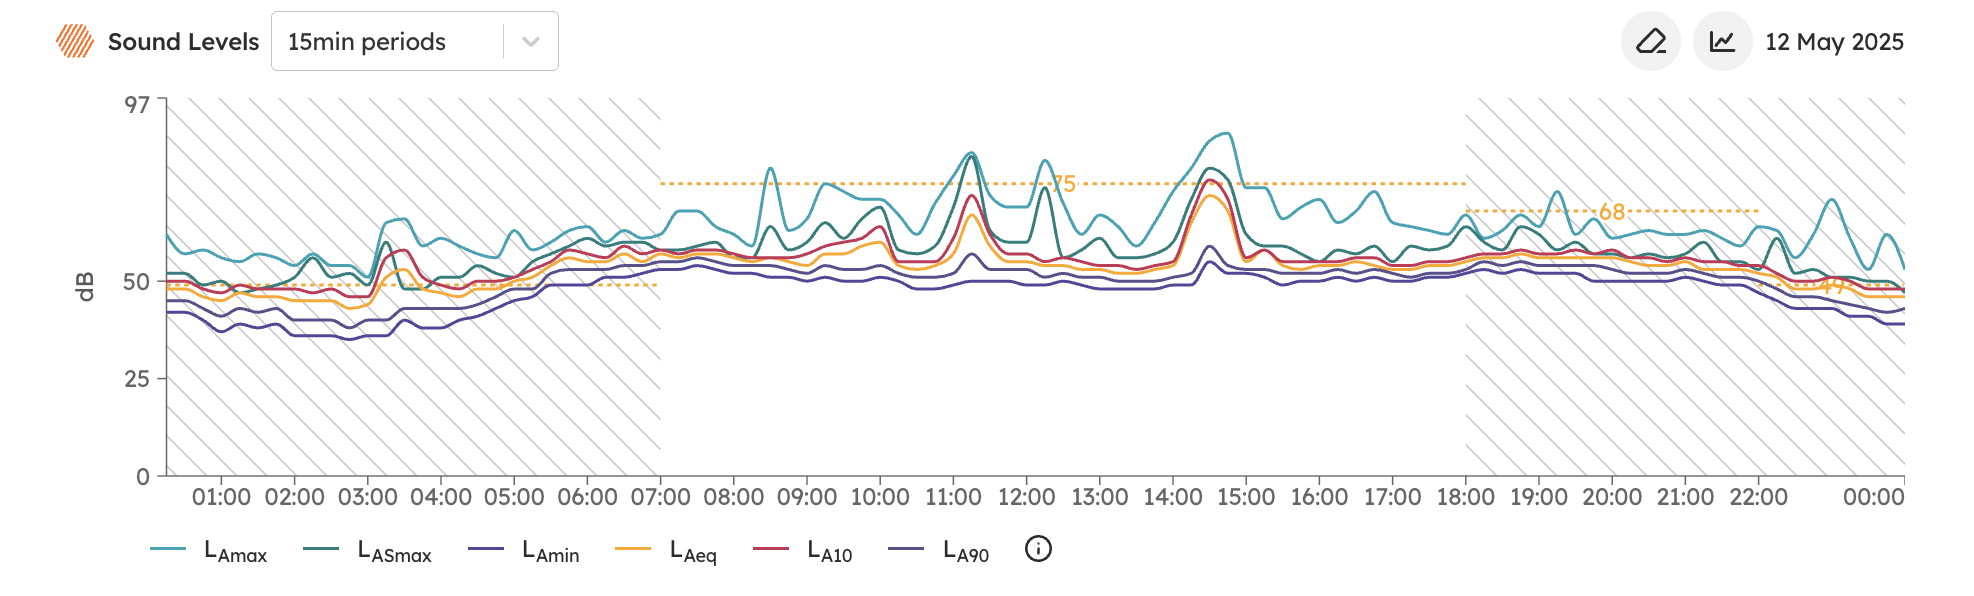
A rule will generate a threshold line on the Dashboard and Reporting graphs that serves as a visual guide.
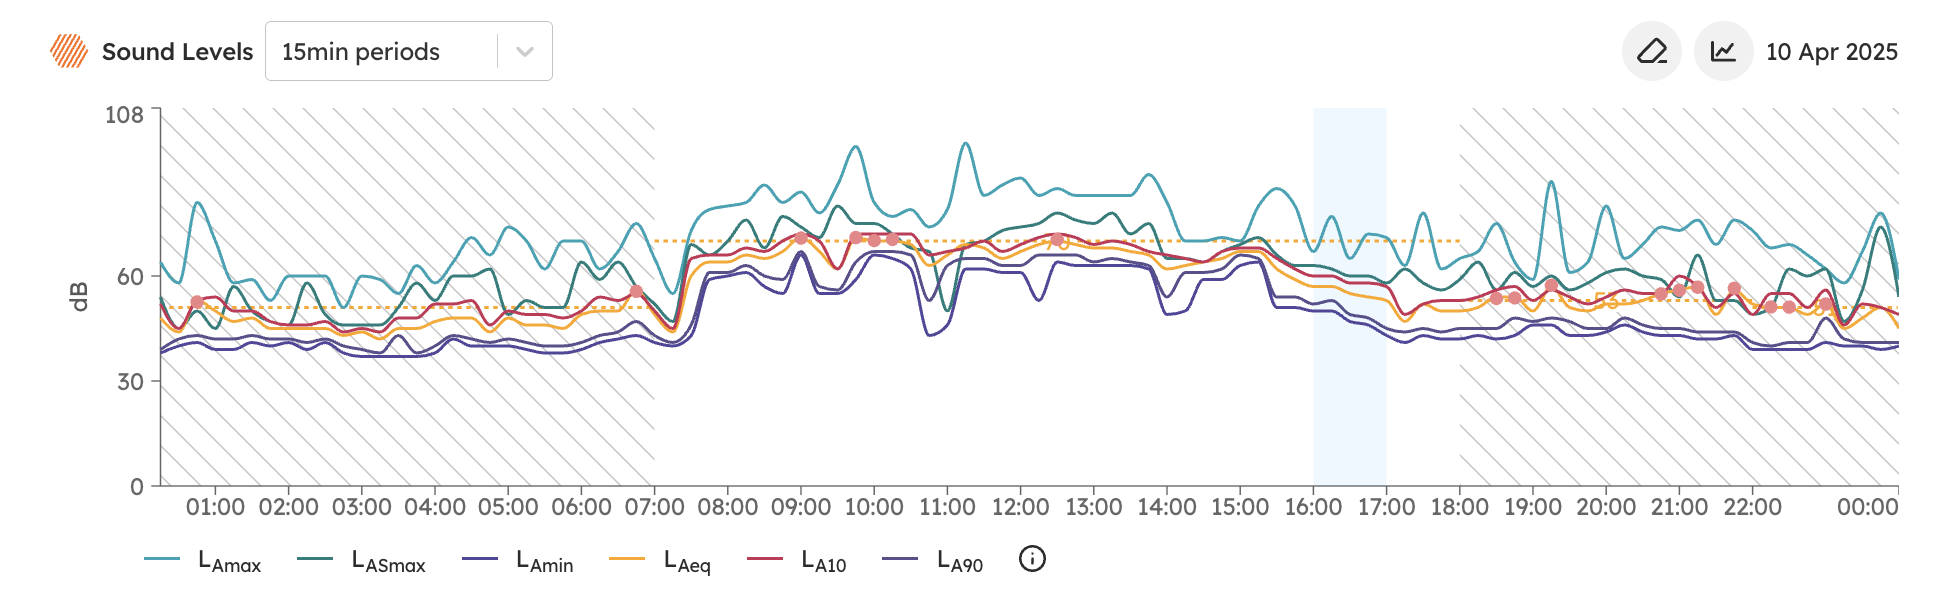
A rule that generates Events will record an event for every instance where data from your site exceeds the threshold, and store that instance as an Event. See Setup Rules and Notifications for the full rule-creation walkthrough.
Managing events
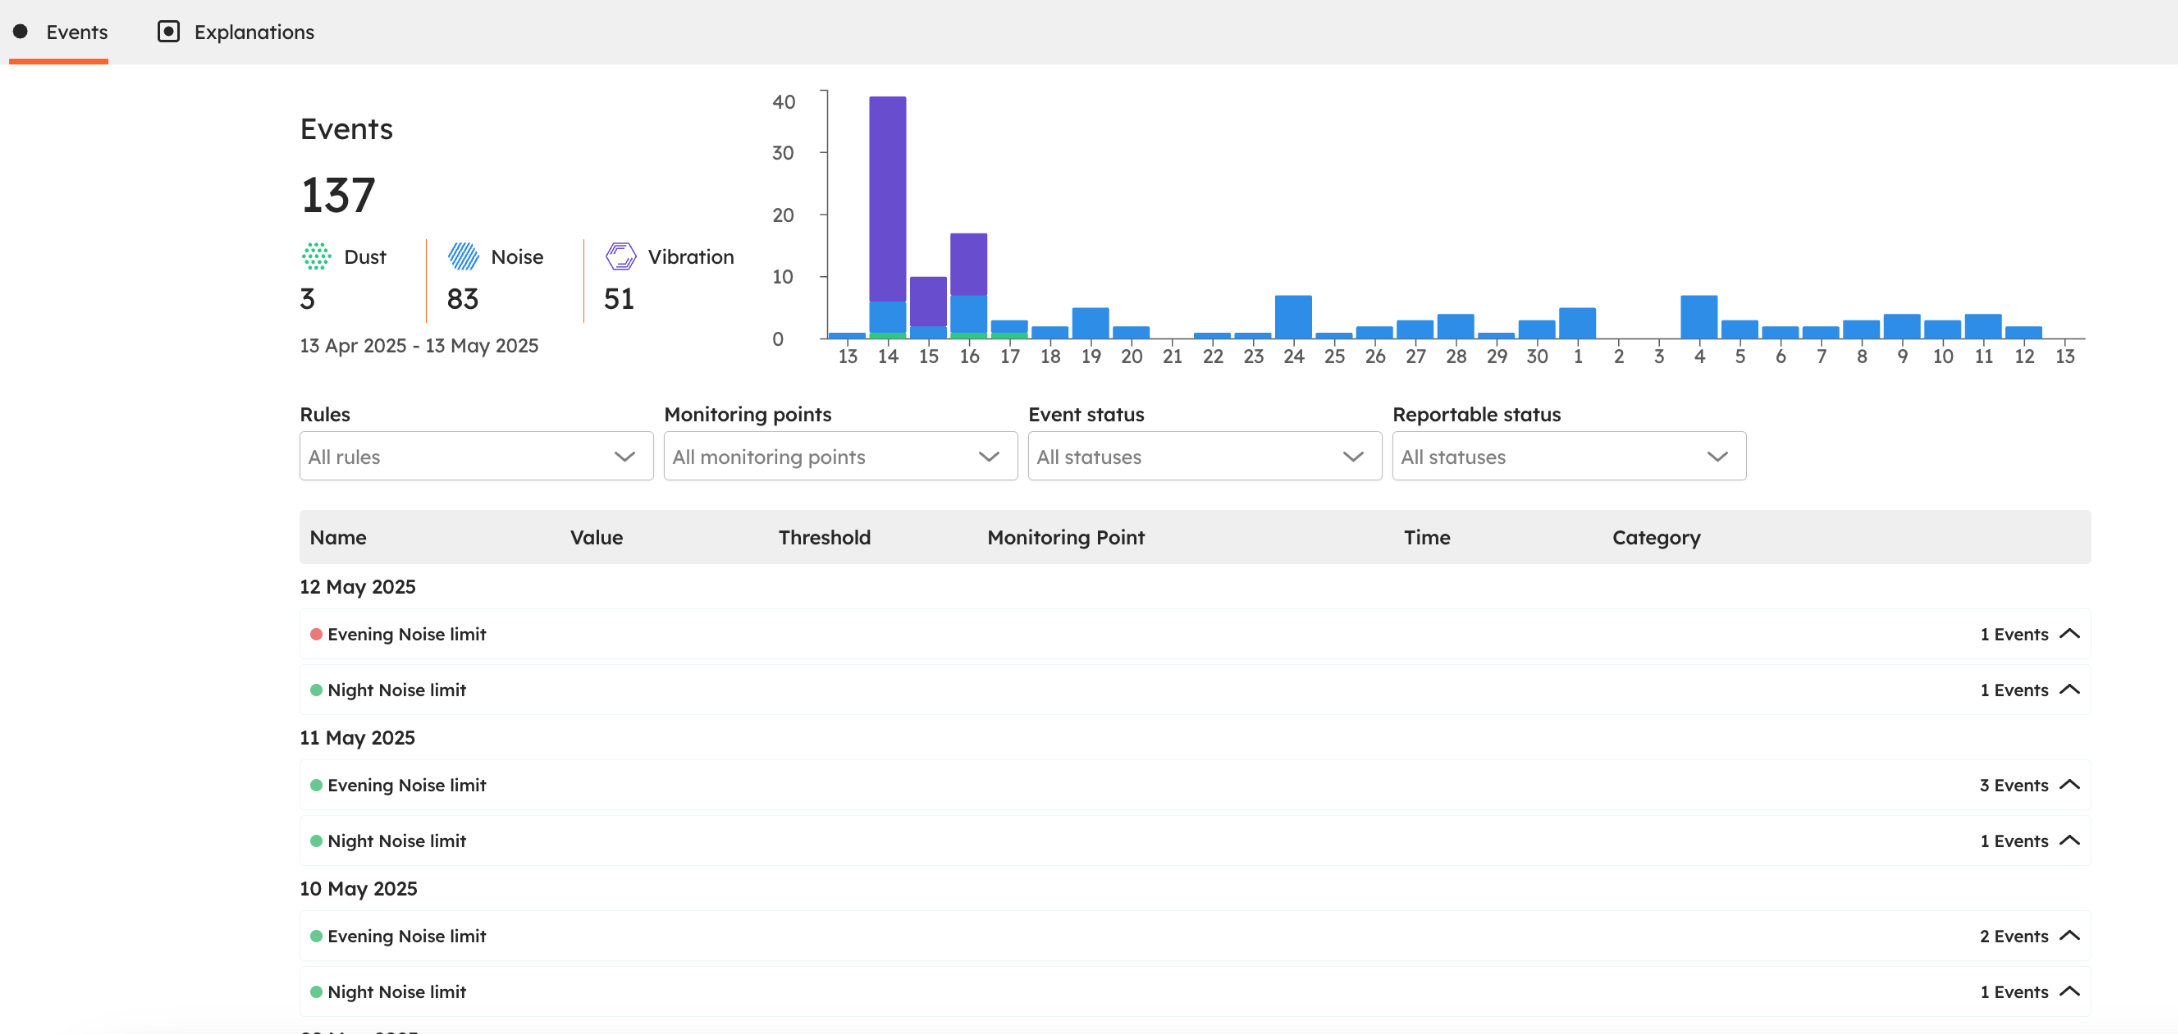
The Events tab within the Events section is where you can track, categorise, and manage your event data for the selected time period. You can:
Categorise Events: create reportable or non-reportable categories like Piling, Birds Chirping, or Traffic for clearer reporting.
Filter Events: refine your view by Aspect, Time Period, Rules, Monitoring Points, Event Status, and Reportable Status to focus on what matters most.
Add Notes: include context or observations for each event, making it easier to recall details later.
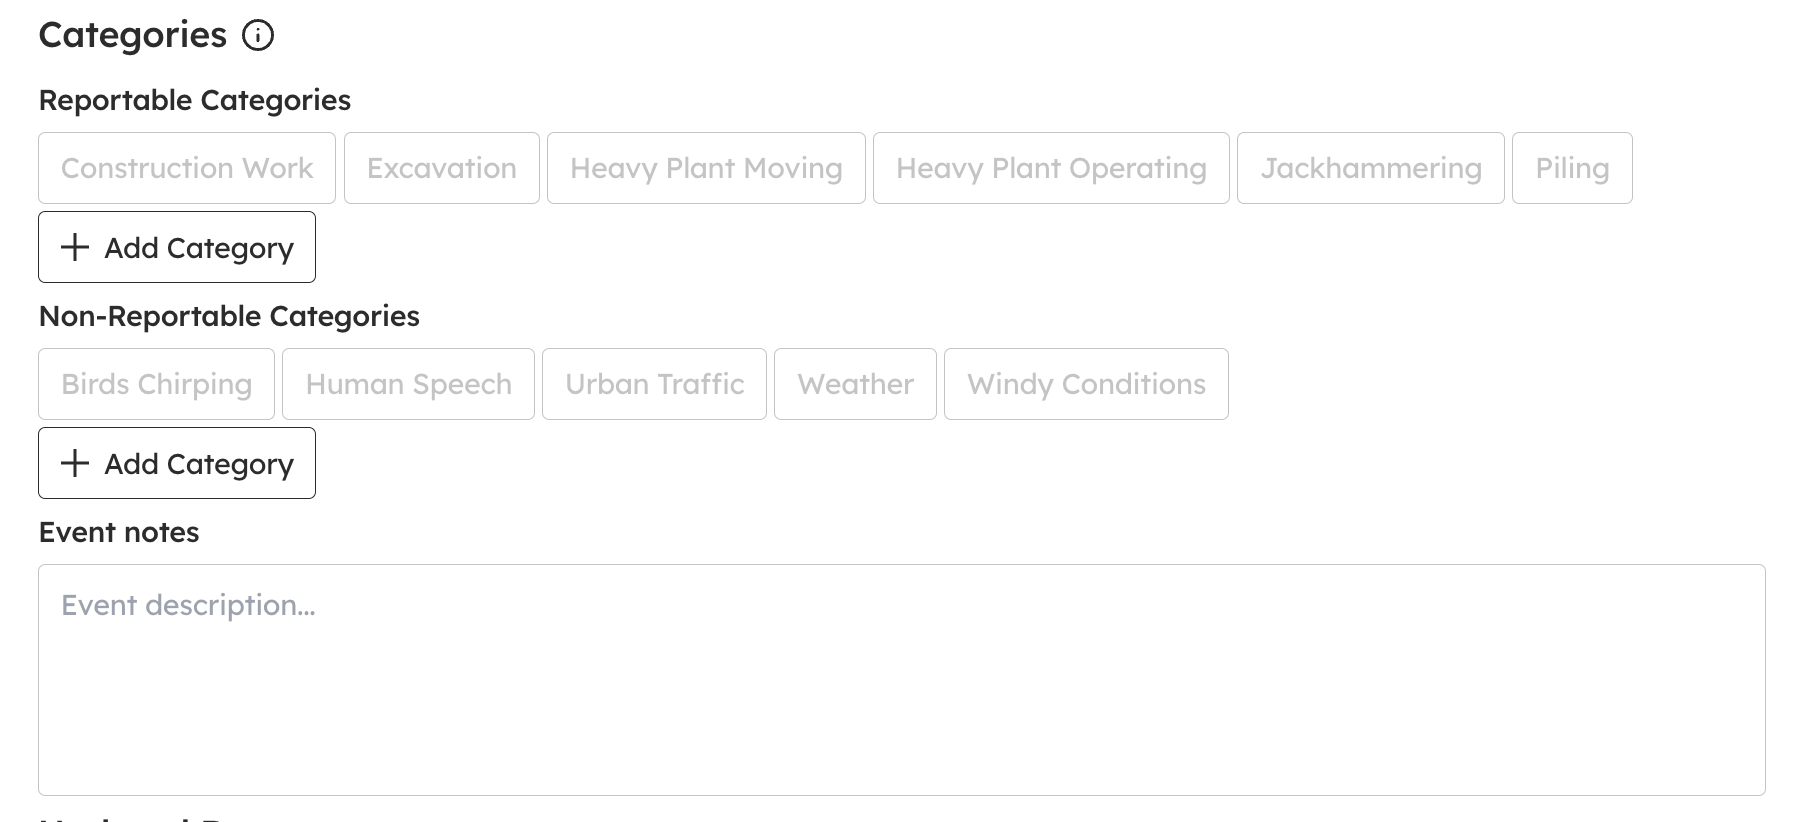
Categories group common event explanations under Reportable and Non-Reportable headings, streamlining monthly reporting.
The Explanation field lets you add specific notes for each event. Events are grouped by day and rule, making bulk investigations quicker and easier, especially when multiple events share the same cause.
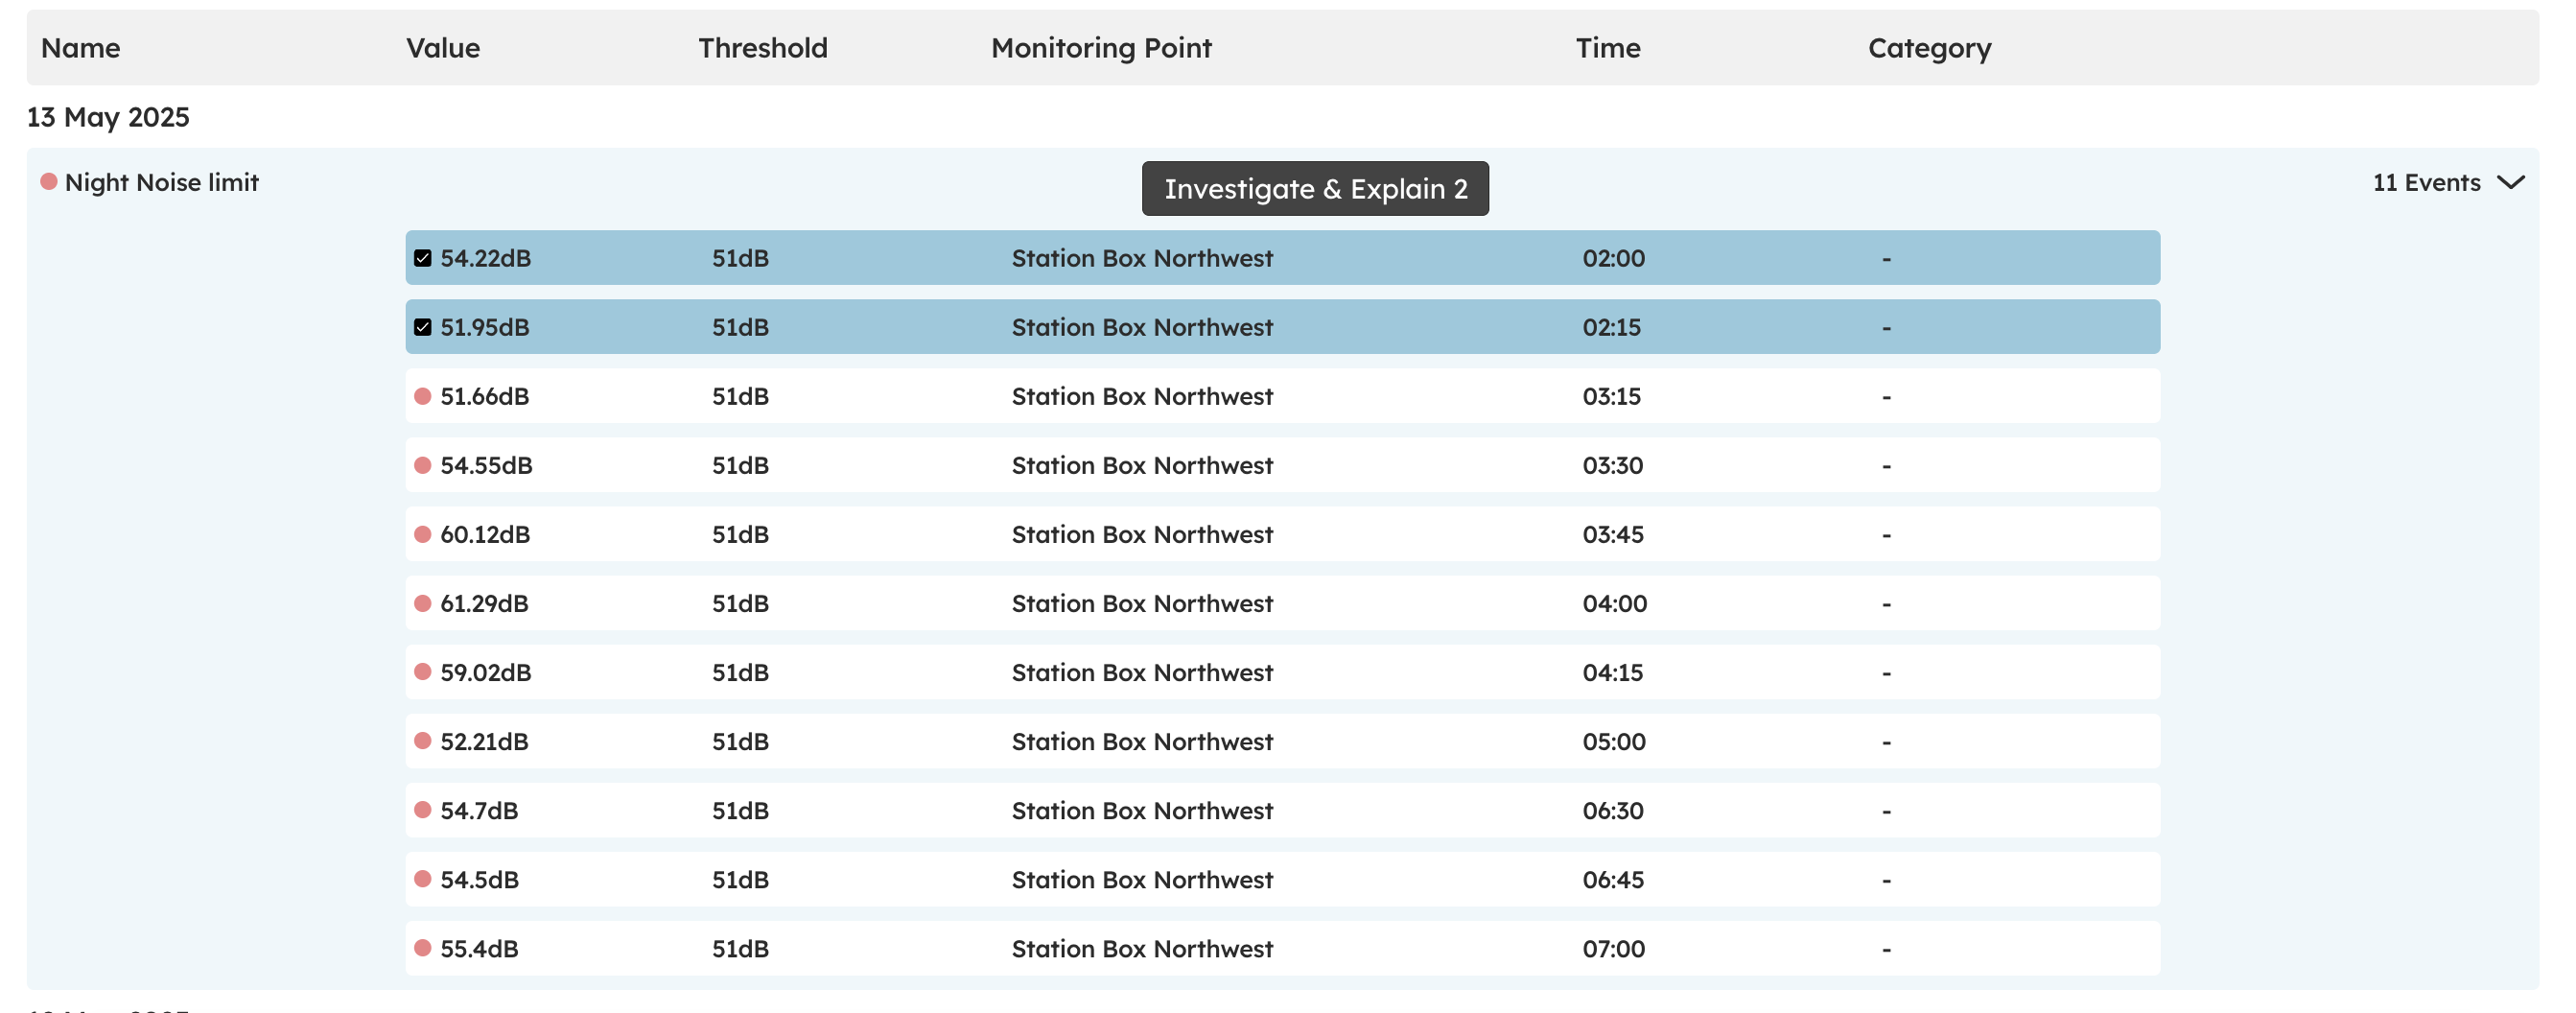
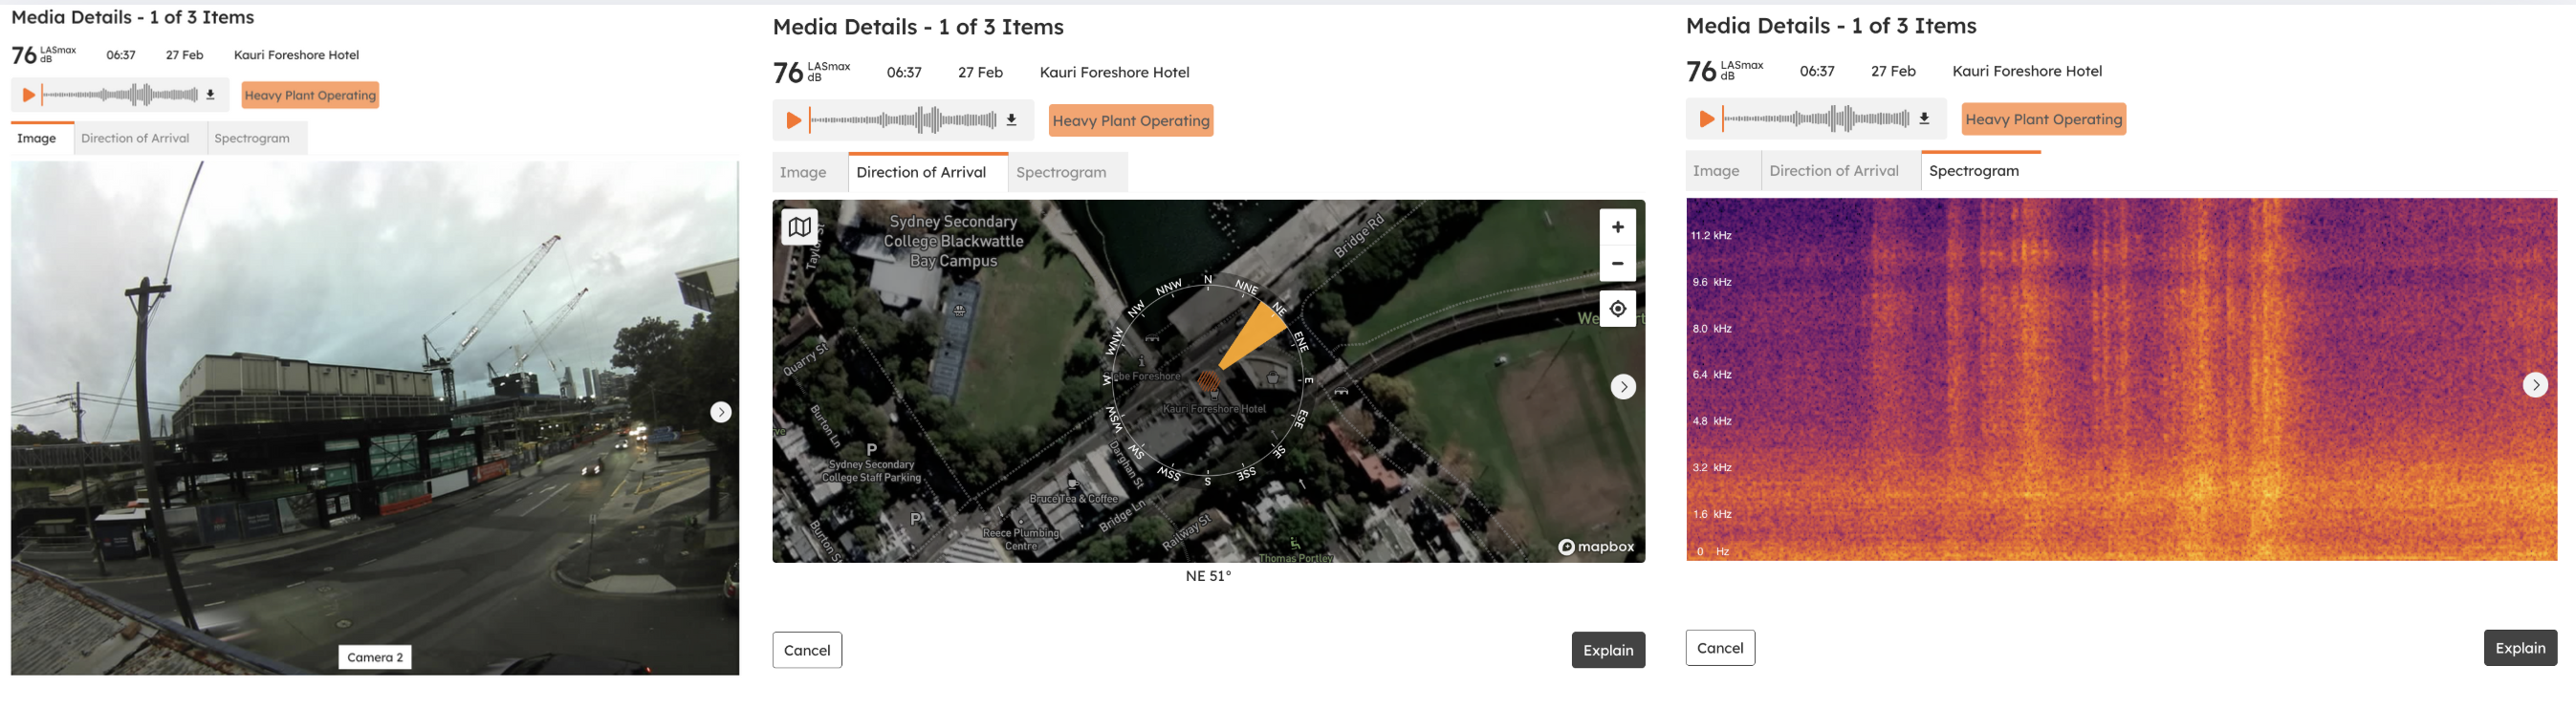
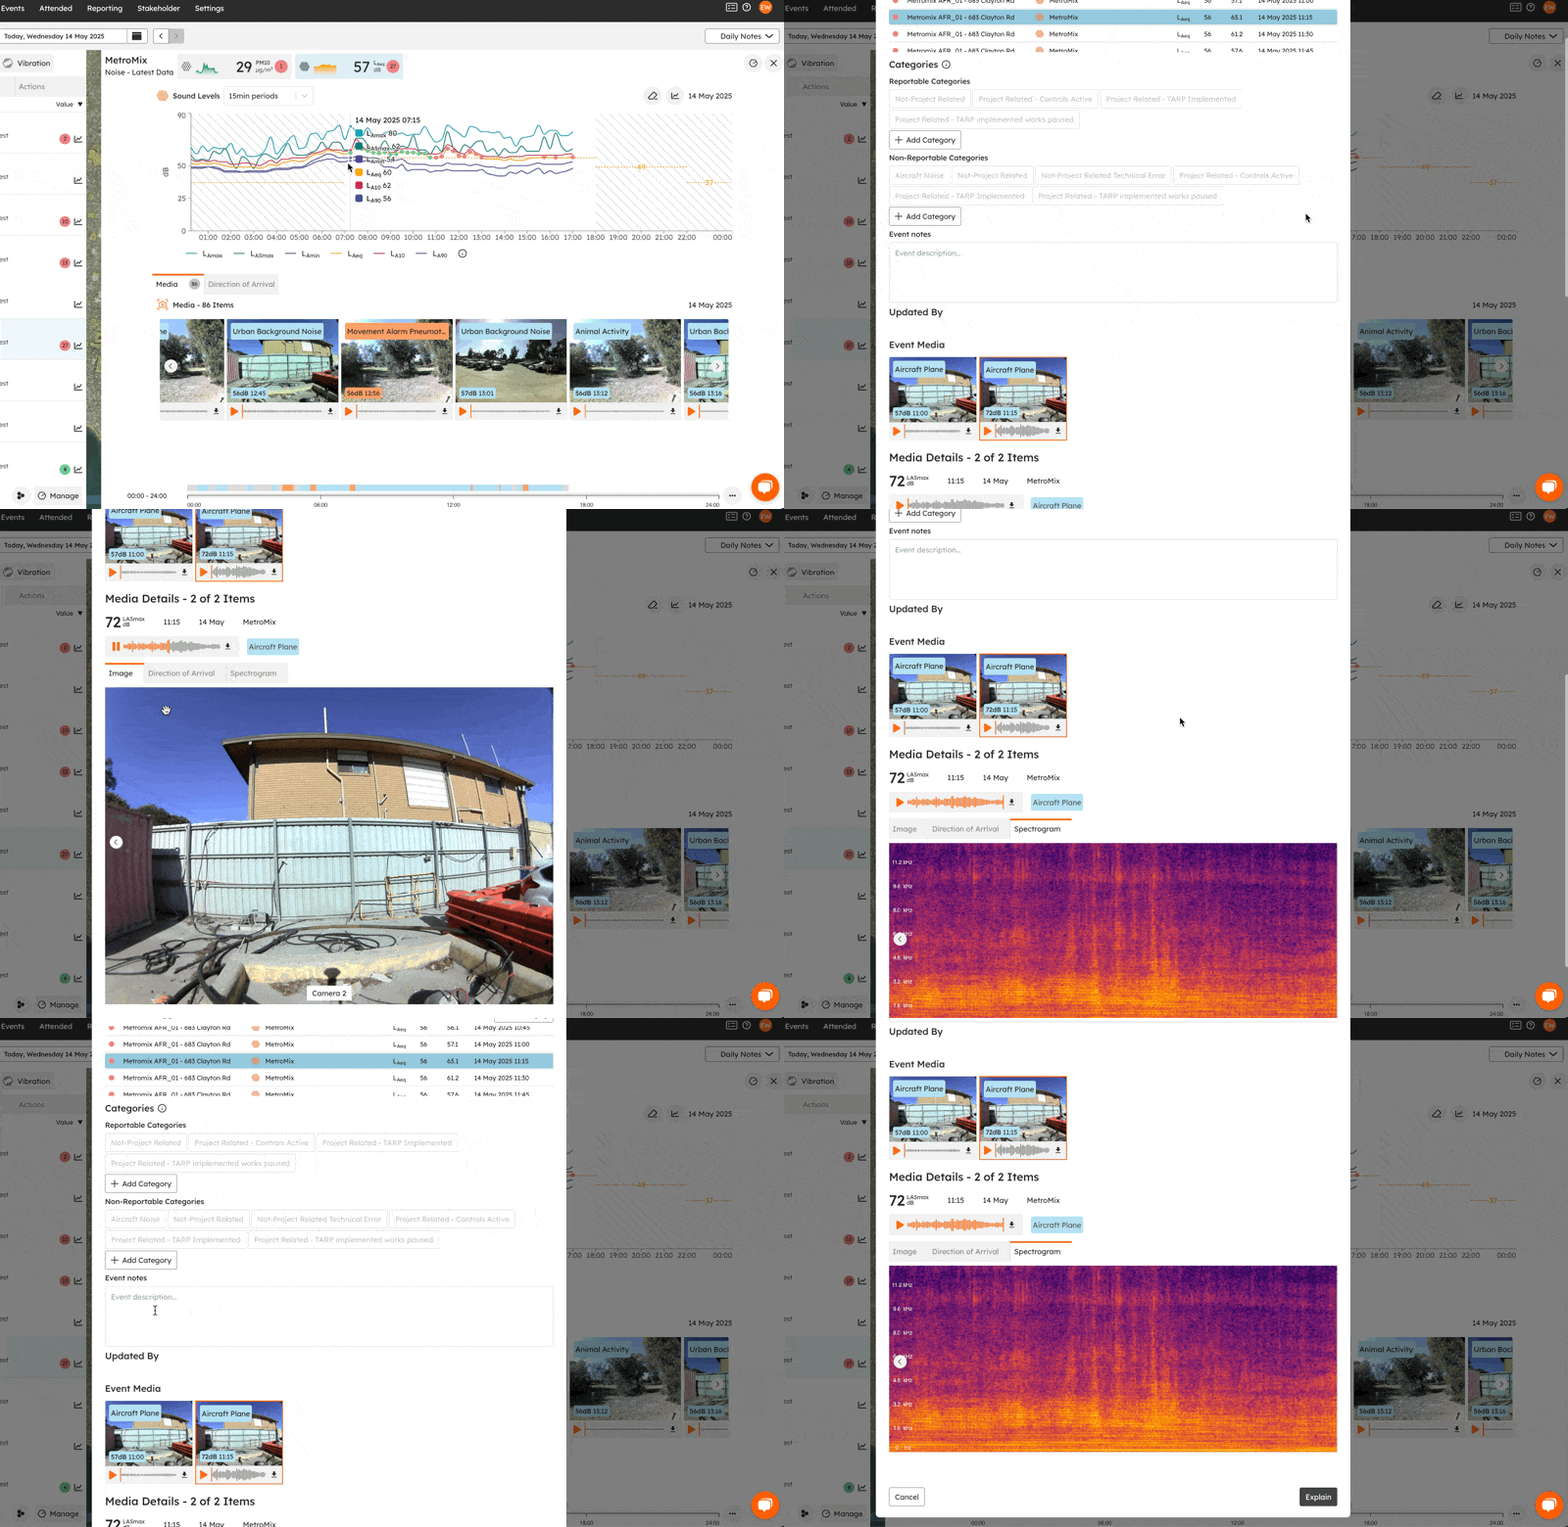
The Investigate button gives you quick access to all the context you need for an exceedance, including images, audio, direction of arrival data, spectrograms and classifications, and (for vibration exceedances) waveforms. This makes on-site event investigation easier, whether you're looking at real-time data or preparing month-end reports.
Managing explanations
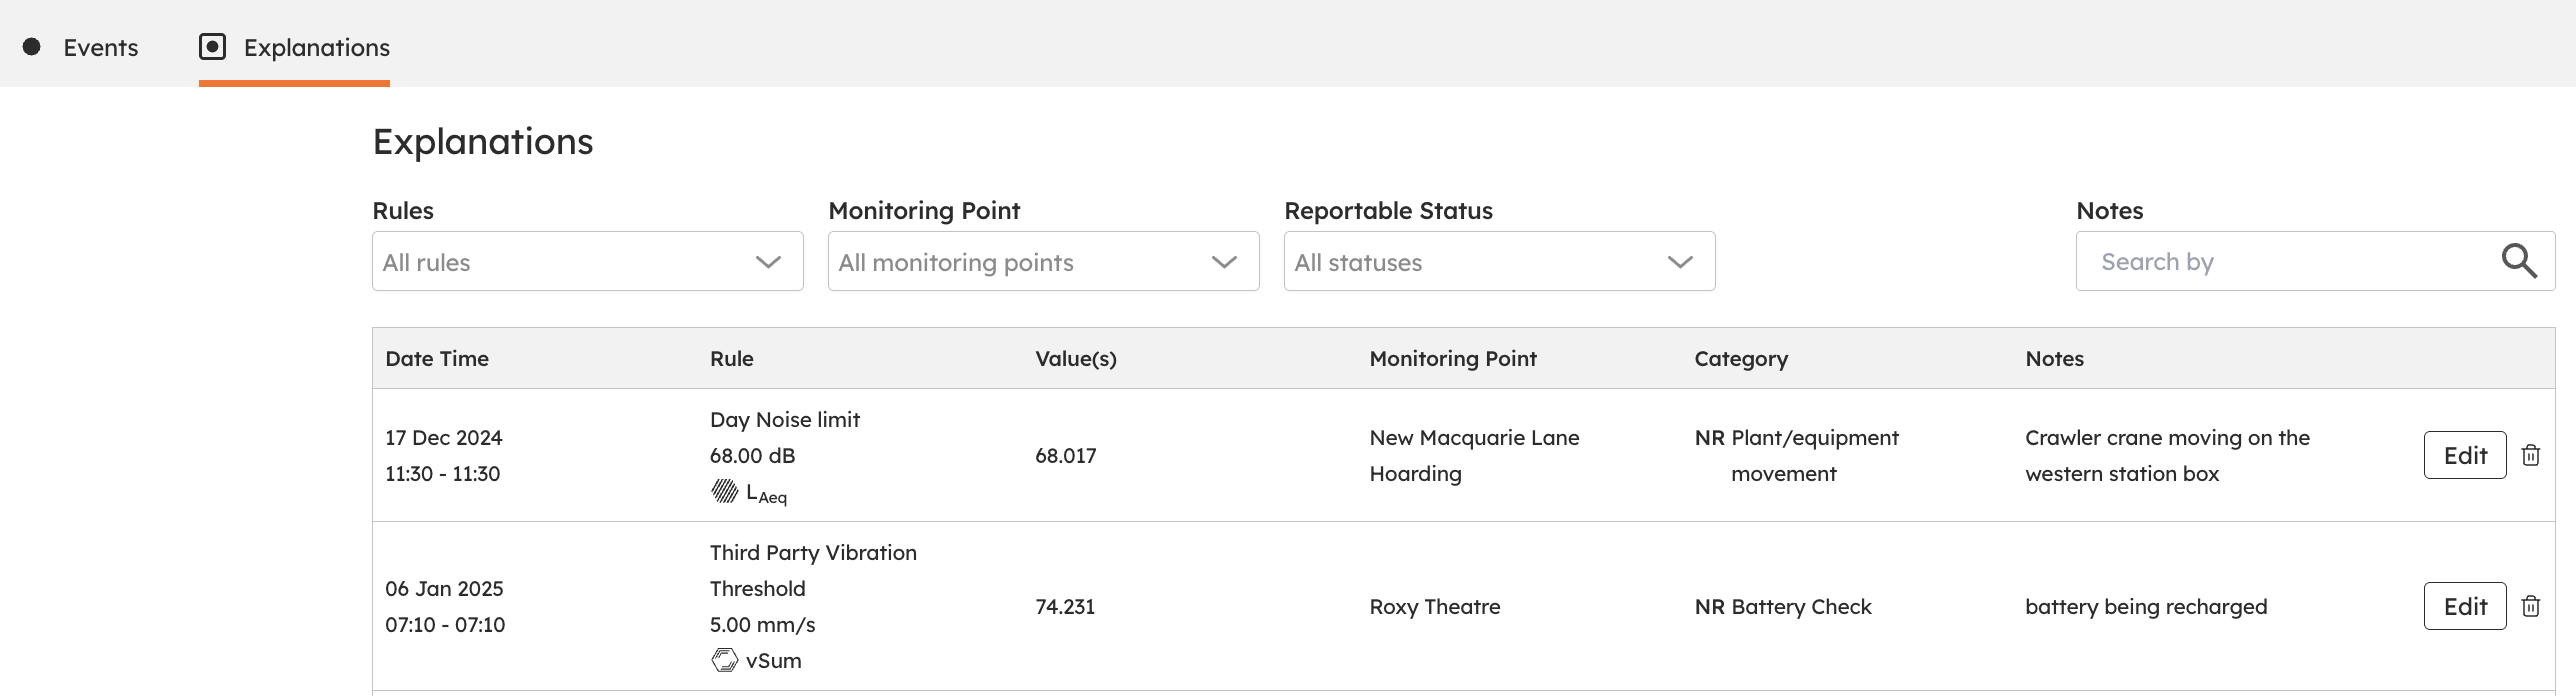
The Explanations tab within the Events section gives you a clear view of all event explanations for the selected time period. You can filter these explanations by:
Rules: to see specific exceedances
Monitoring Points: to focus on particular locations
Reportable Status: to highlight reportable events
Notes: for quick reference to any comments added
Each explanation provides key details, including:
Date and Time: when the exceedance occurred
Rule Exceeded: the specific threshold that was breached
Exceedance Value: the recorded level that triggered the event
Monitoring Point: the device location
Category: the type of exceedance
Note: any additional information added
You can also edit or delete explanations as needed, making it easy to keep your records accurate and up to date.
Events on dashboard
Unexplained events appear as red dots on the dashboard for real-time investigation. Once an event has been explained, its dot turns green, indicating it has been addressed.
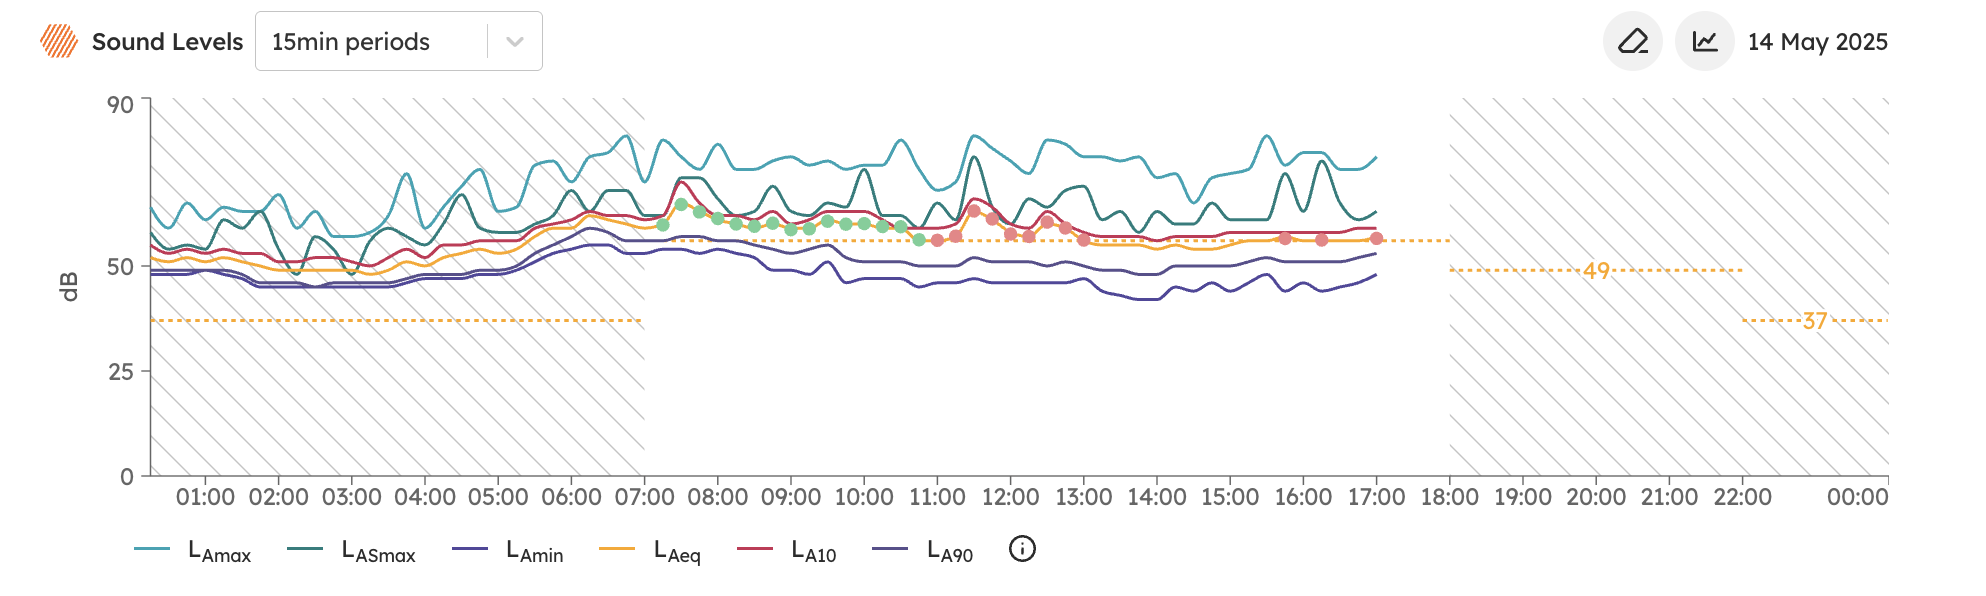
Clicking an event bubble takes you directly to the Events tab for further investigation and explanation.
Reporting events
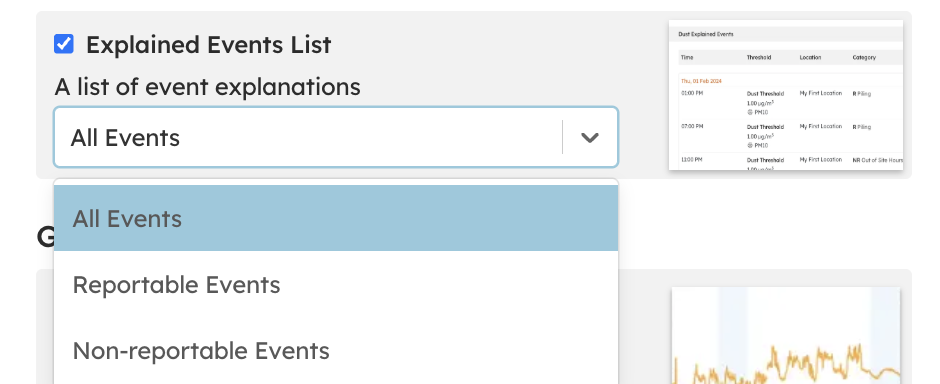
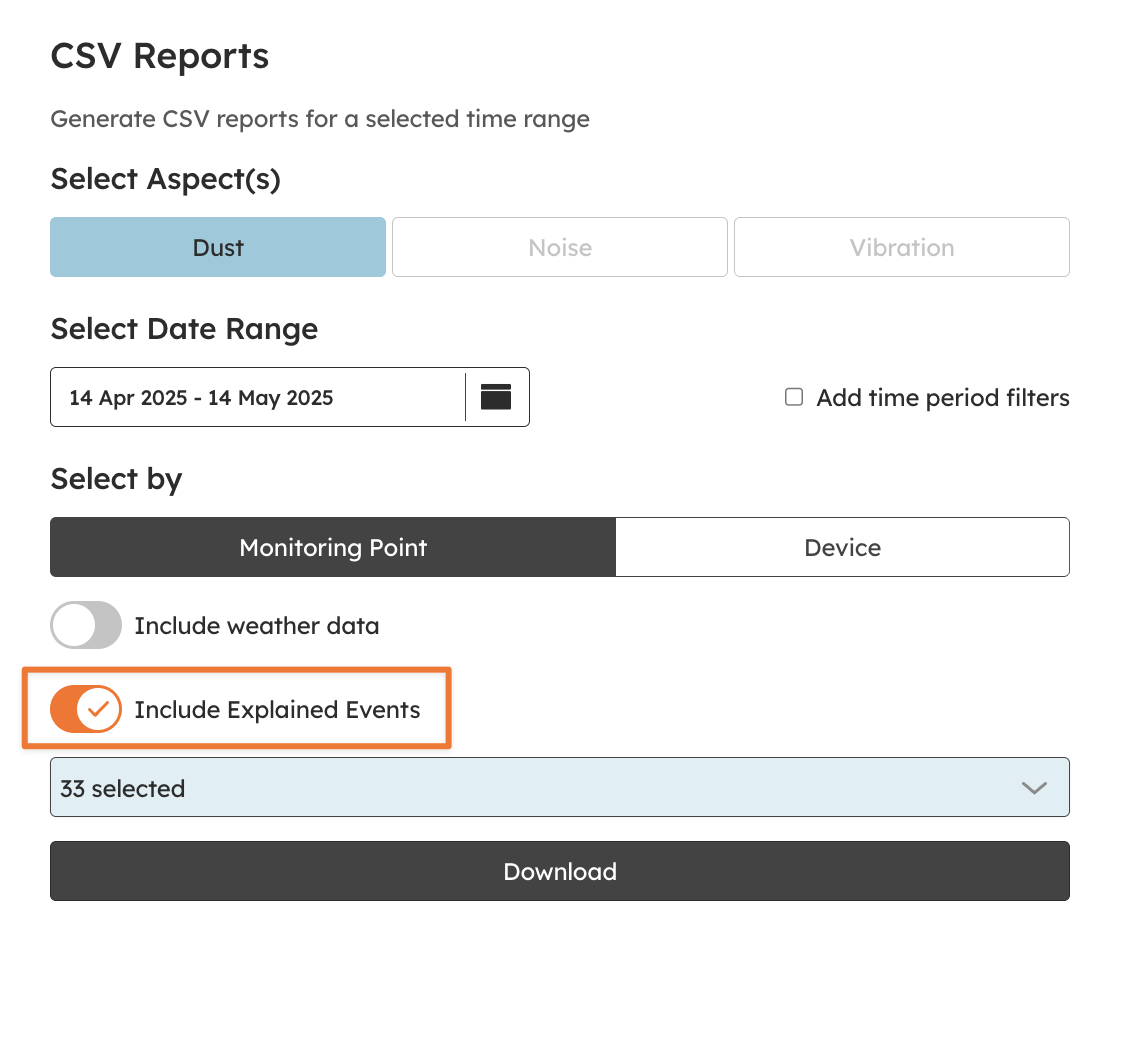
Events is a key feature to incorporate into end-of-month reporting. Events can be included in SiteHive-generated PDF and CSV reports, filtered to Reportable events, Non-Reportable events, or both. This makes it easy to account for and report exceedances of site thresholds.
PDF reports
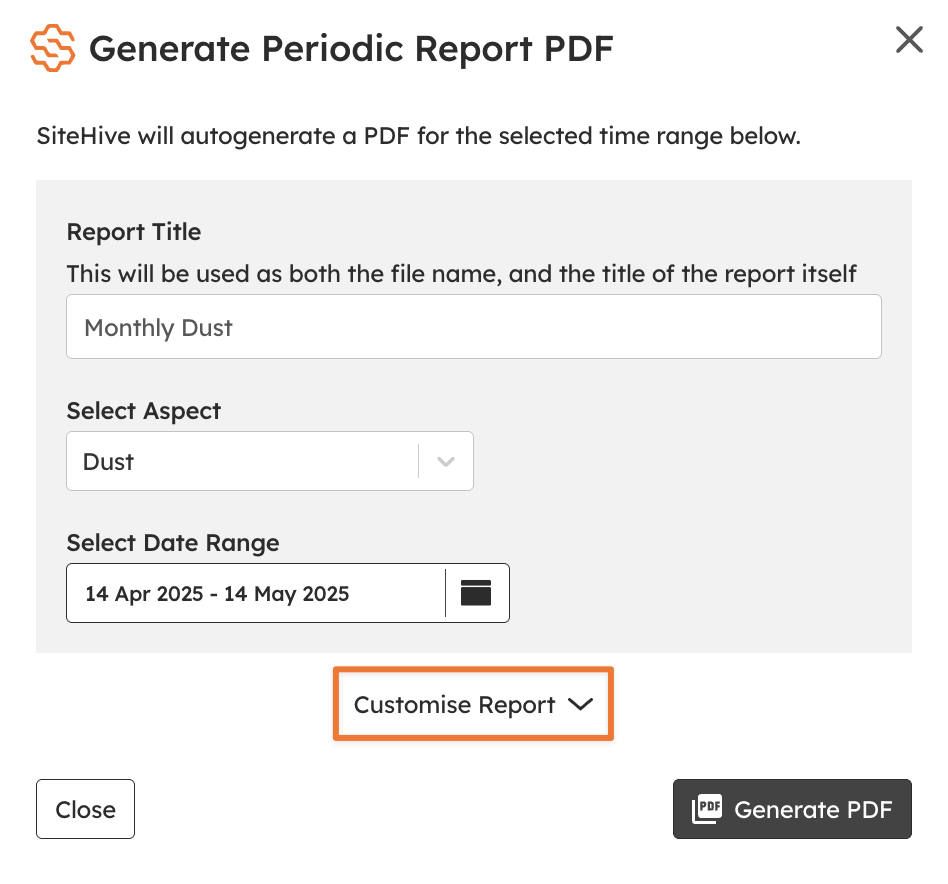
Tick the Events options in the PDF report preferences:
CSV
Events can also be exported via CSV Reports:
What’s next
Setup Rules and Notifications (create the rules that generate events)
PDF Reports (put explained events into your monthly report)
Audio Classifier (the classifications and spectrograms behind Investigate)