
SiteHive Dust: what it measures and how
The SiteHive Hexanode Dust and SiteHive Hexanode Noise+Dust devices monitor dust in real time. They fit into your environmental monitoring whether you are focused on regulatory compliance, site management or proactive community engagement, and give you actionable insight into dust events and trends.
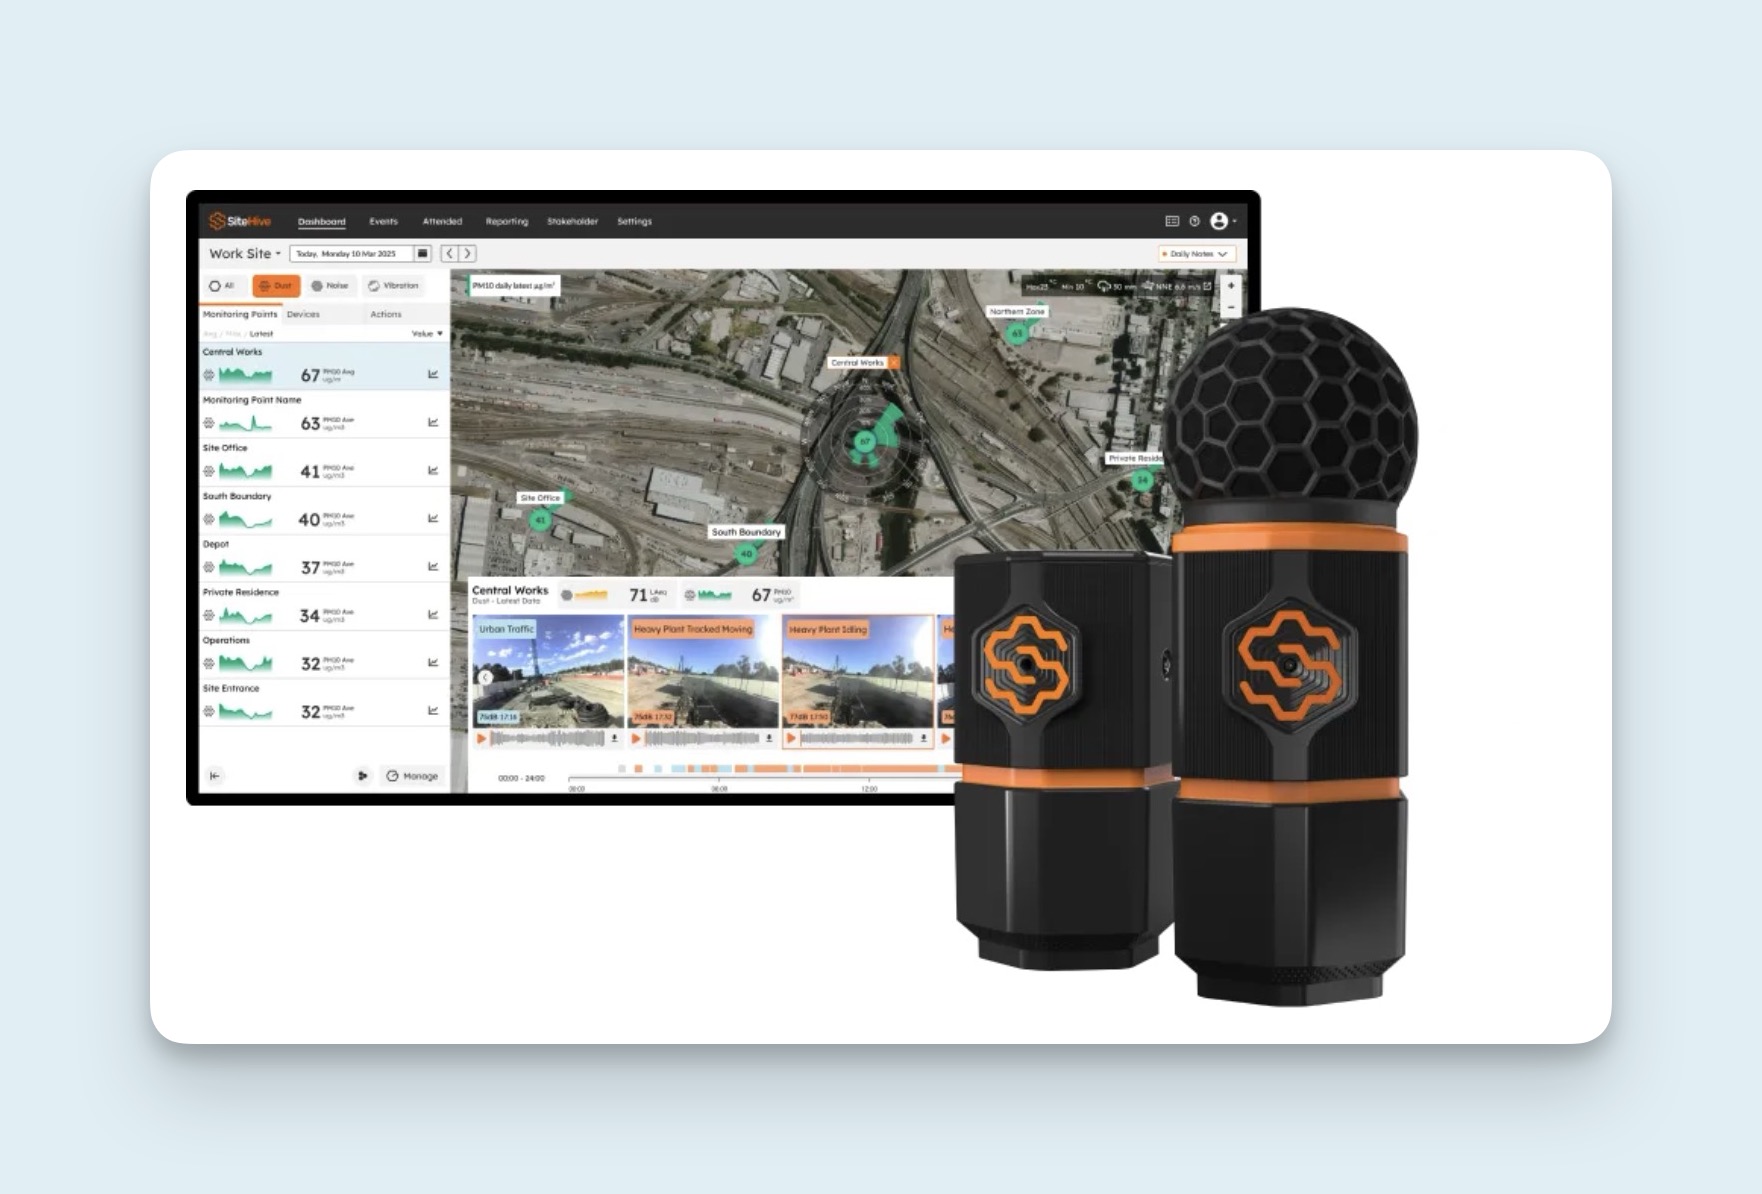
Next-gen Hexanode Dust devices are accurate, reliable and adaptable.
Capture real-time PM2.5 and PM10, even in humid conditions.
Event-triggered images, audio and DoA mapping give you full visibility.
Can be used standalone or paired with noise monitoring (Hexanode Noise+Dust).
Remote updates and connectivity ensure consistent, high-quality data.
Real-time PM2.5 and PM10
Dust monitors measure airborne particulate matter, giving continuous, real-time insight into site conditions.
The Hexanode tracks the key particle sizes, PM2.5 and PM10, so you can monitor trends, identify sources of dust and act on site impacts at any time.
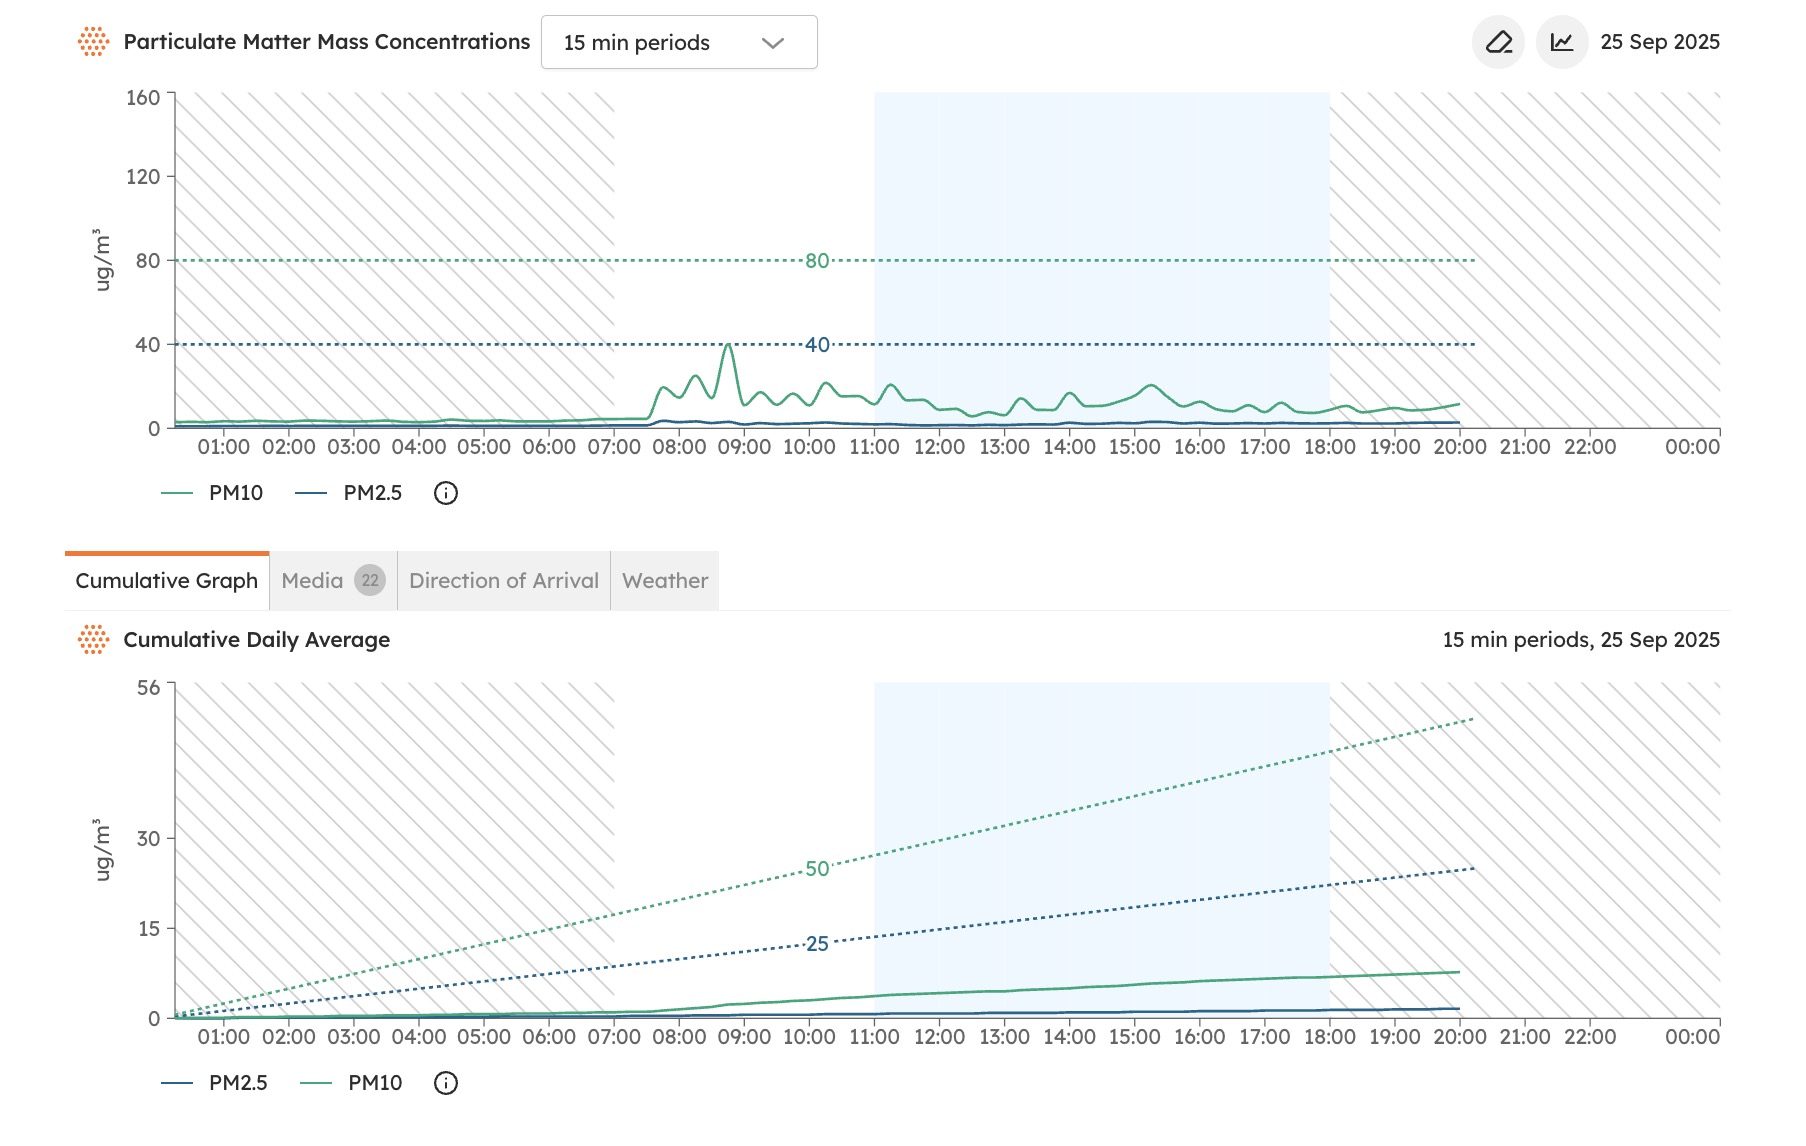
PM10: particles smaller than 10 micrometres, often from construction or earthworks.
PM2.5: finer particles smaller than 2.5 micrometres, which can affect human health at higher levels.
Real-time tracking: Hexanode devices report every 15 minutes, giving a real-time view of dust conditions.
Adapts to humid conditions
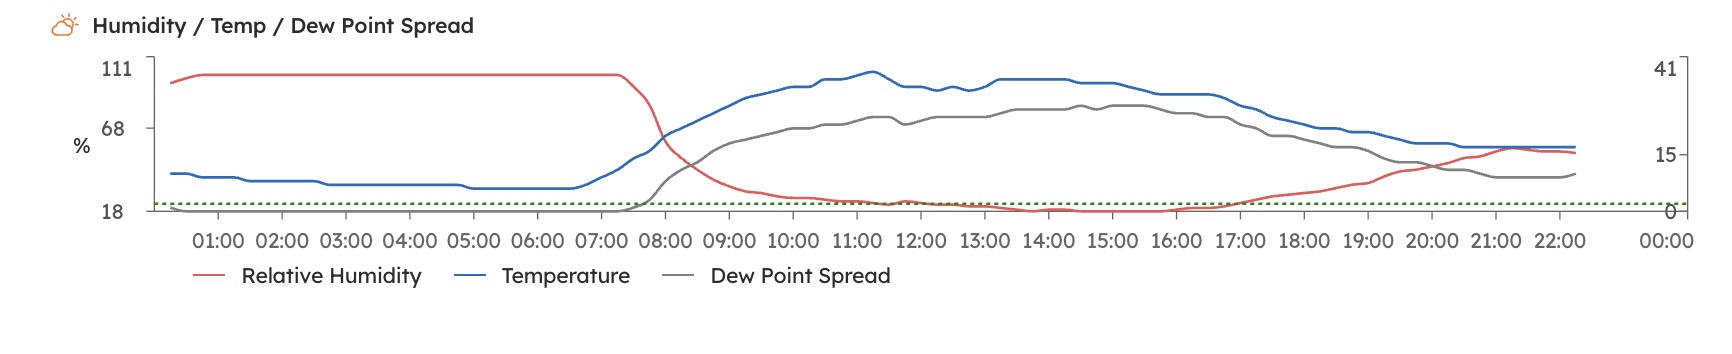
The Hexanode Dust and Hexanode Noise+Dust devices use a built-in temperature and humidity gauge (THG) with a software modulator to detect and correct for humidity in real time.
Moisture in the air can otherwise be measured as particulate matter. The correction keeps it from skewing your readings, so even in high relative humidity or at low dew points your dust measurements stay accurate and reliable.
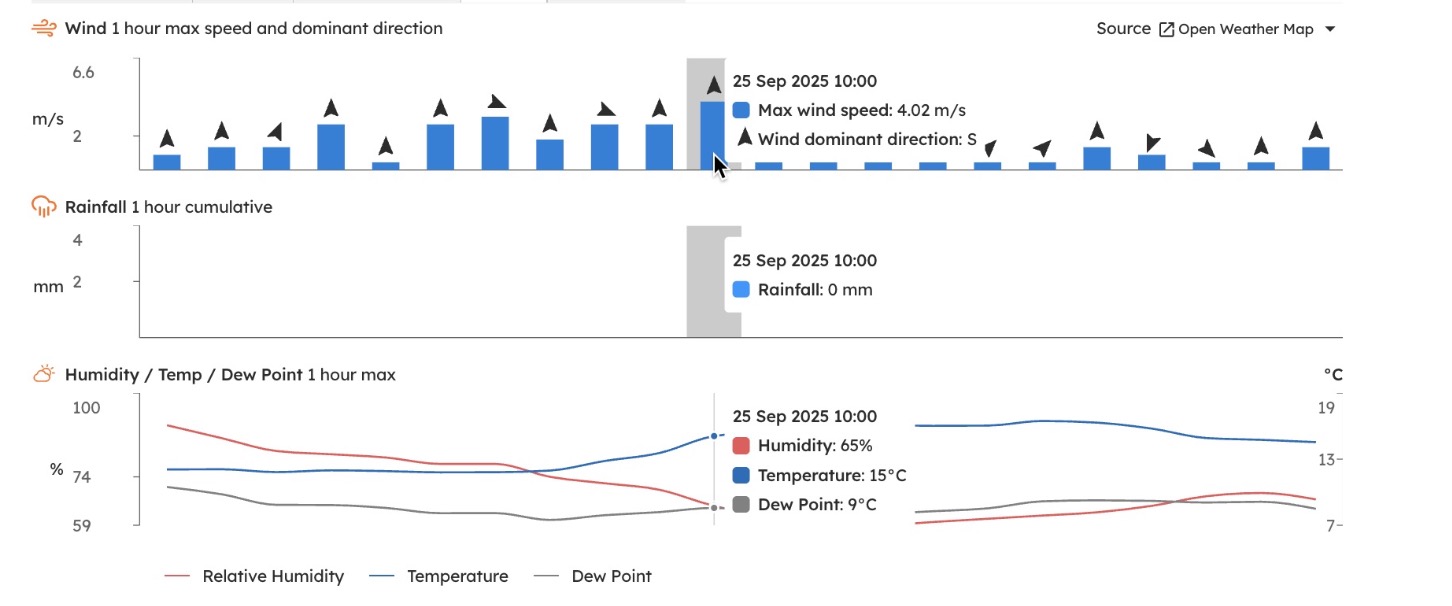
For additional context, SiteHive also provides weather data automatically. Nearby or on-site weather from OpenWeather, the Bureau of Meteorology or your own weather station is integrated into your Dashboard, giving you a complete picture of conditions when reviewing dust activity (see SiteHive Weather: what it measures).
Event-triggered images & audio
Understanding the cause of a dust event is critical. Hexanode devices capture images and short audio clips automatically whenever an event is recorded, giving you context alongside your monitoring data so you can quickly see what was happening on site.
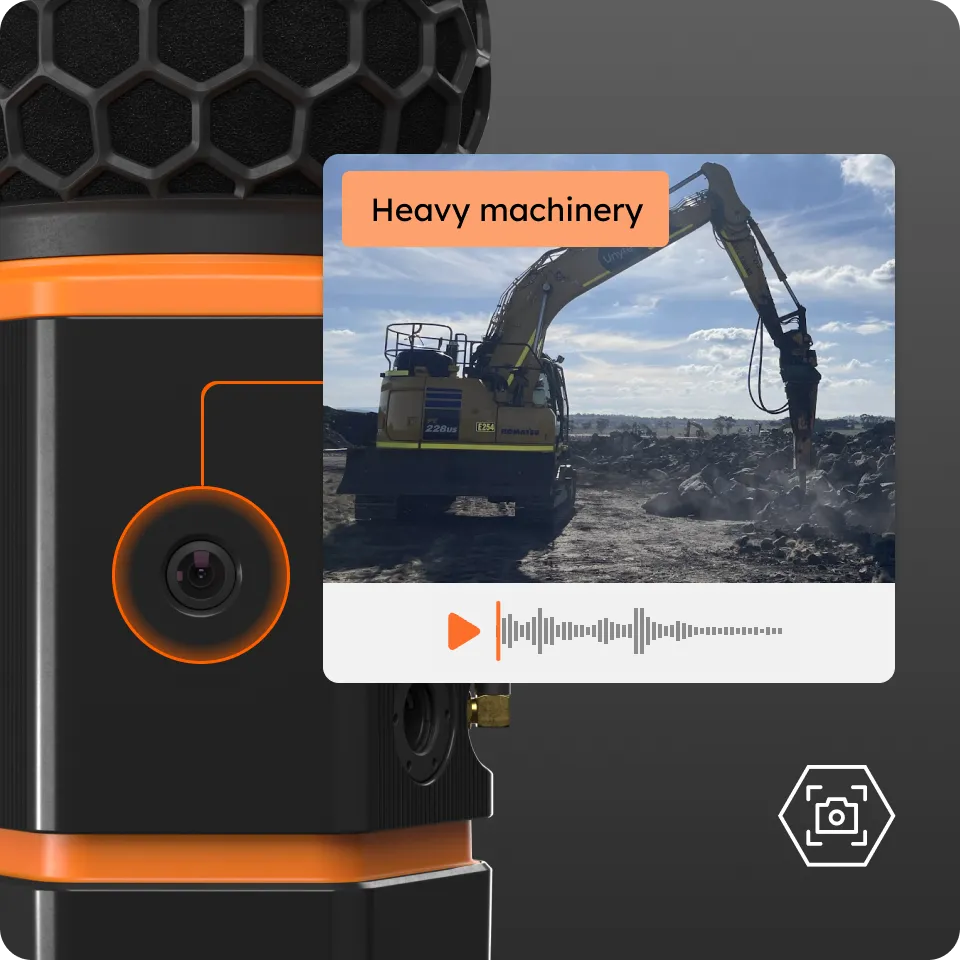
Here is what comes with every exceedance:
Time-stamped image: a still image captured at the moment of the event, a clear visual record of site conditions.
6 seconds of audio: a clip for each event, 3 seconds before the exceedance and 3 seconds during, so you can hear what was happening.
Integrated insights: images and audio are stored in the SiteHive software alongside your dust data, so reviewing an event and deciding whether it was site activity or an external factor is fast and straightforward.
AI Audio Classifier (SiteHive Enviro Pro): the Hexanode analyses and classifies noise events in real time, comparing captured audio to a comprehensive database to identify the likely source. Each event is labelled and colour-coded, so you can see at a glance whether an exceedance is project-related or external.
Direction of Arrival (DoA) mapping
The Hexanode does not just measure dust and noise, it helps you understand where they come from.
Direction of Arrival (DoA) mapping links dust and noise readings with wind direction data to pinpoint the likely source and track how activity moves across your site.
How it works:
Every 15 minutes, the Hexanode matches particulate matter (PM) readings with real-time wind direction data.
This produces a DoA graph showing the concentration of dust by direction, as a percentage over the selected period.
The device's orientation and directional sensors keep the data aligned, giving you an accurate picture of source locations.
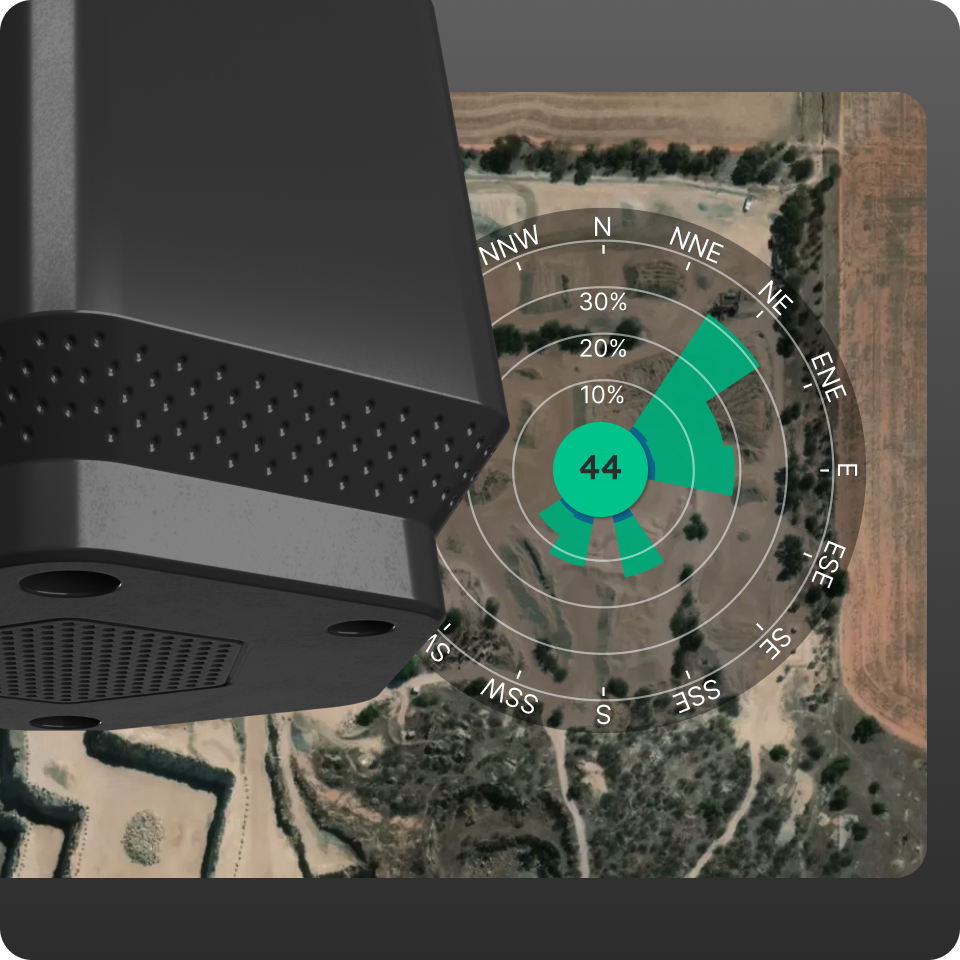
On the SiteHive Dashboard:
Map indicators: the map shows the dominant directions for dust and noise activity.
Detailed visualisation: click a Monitoring Point for a full DoA visualisation of where activity is coming from.
Media integration: pair DoA with event images and audio to see not only when something happened but where it came from.
With DoA you go beyond seeing levels: you can understand and manage the actual sources of dust and noise affecting your site.
What's next
Direction of arrival: where the noise came from (the DoA map and chart in detail)
Set up media triggers (the level that captures photos and audio)
Calibration and certificates (how calibration is managed and where the certificates are)