
3D building view
The Dashboard map can show your Monitoring Points in a 3D building view, so you can see where each one sits vertically within buildings and across multiple levels, not just where it is on the ground.
When enabled, the 3D building view lives in the Dashboard's interactive map (see Dashboard overview).
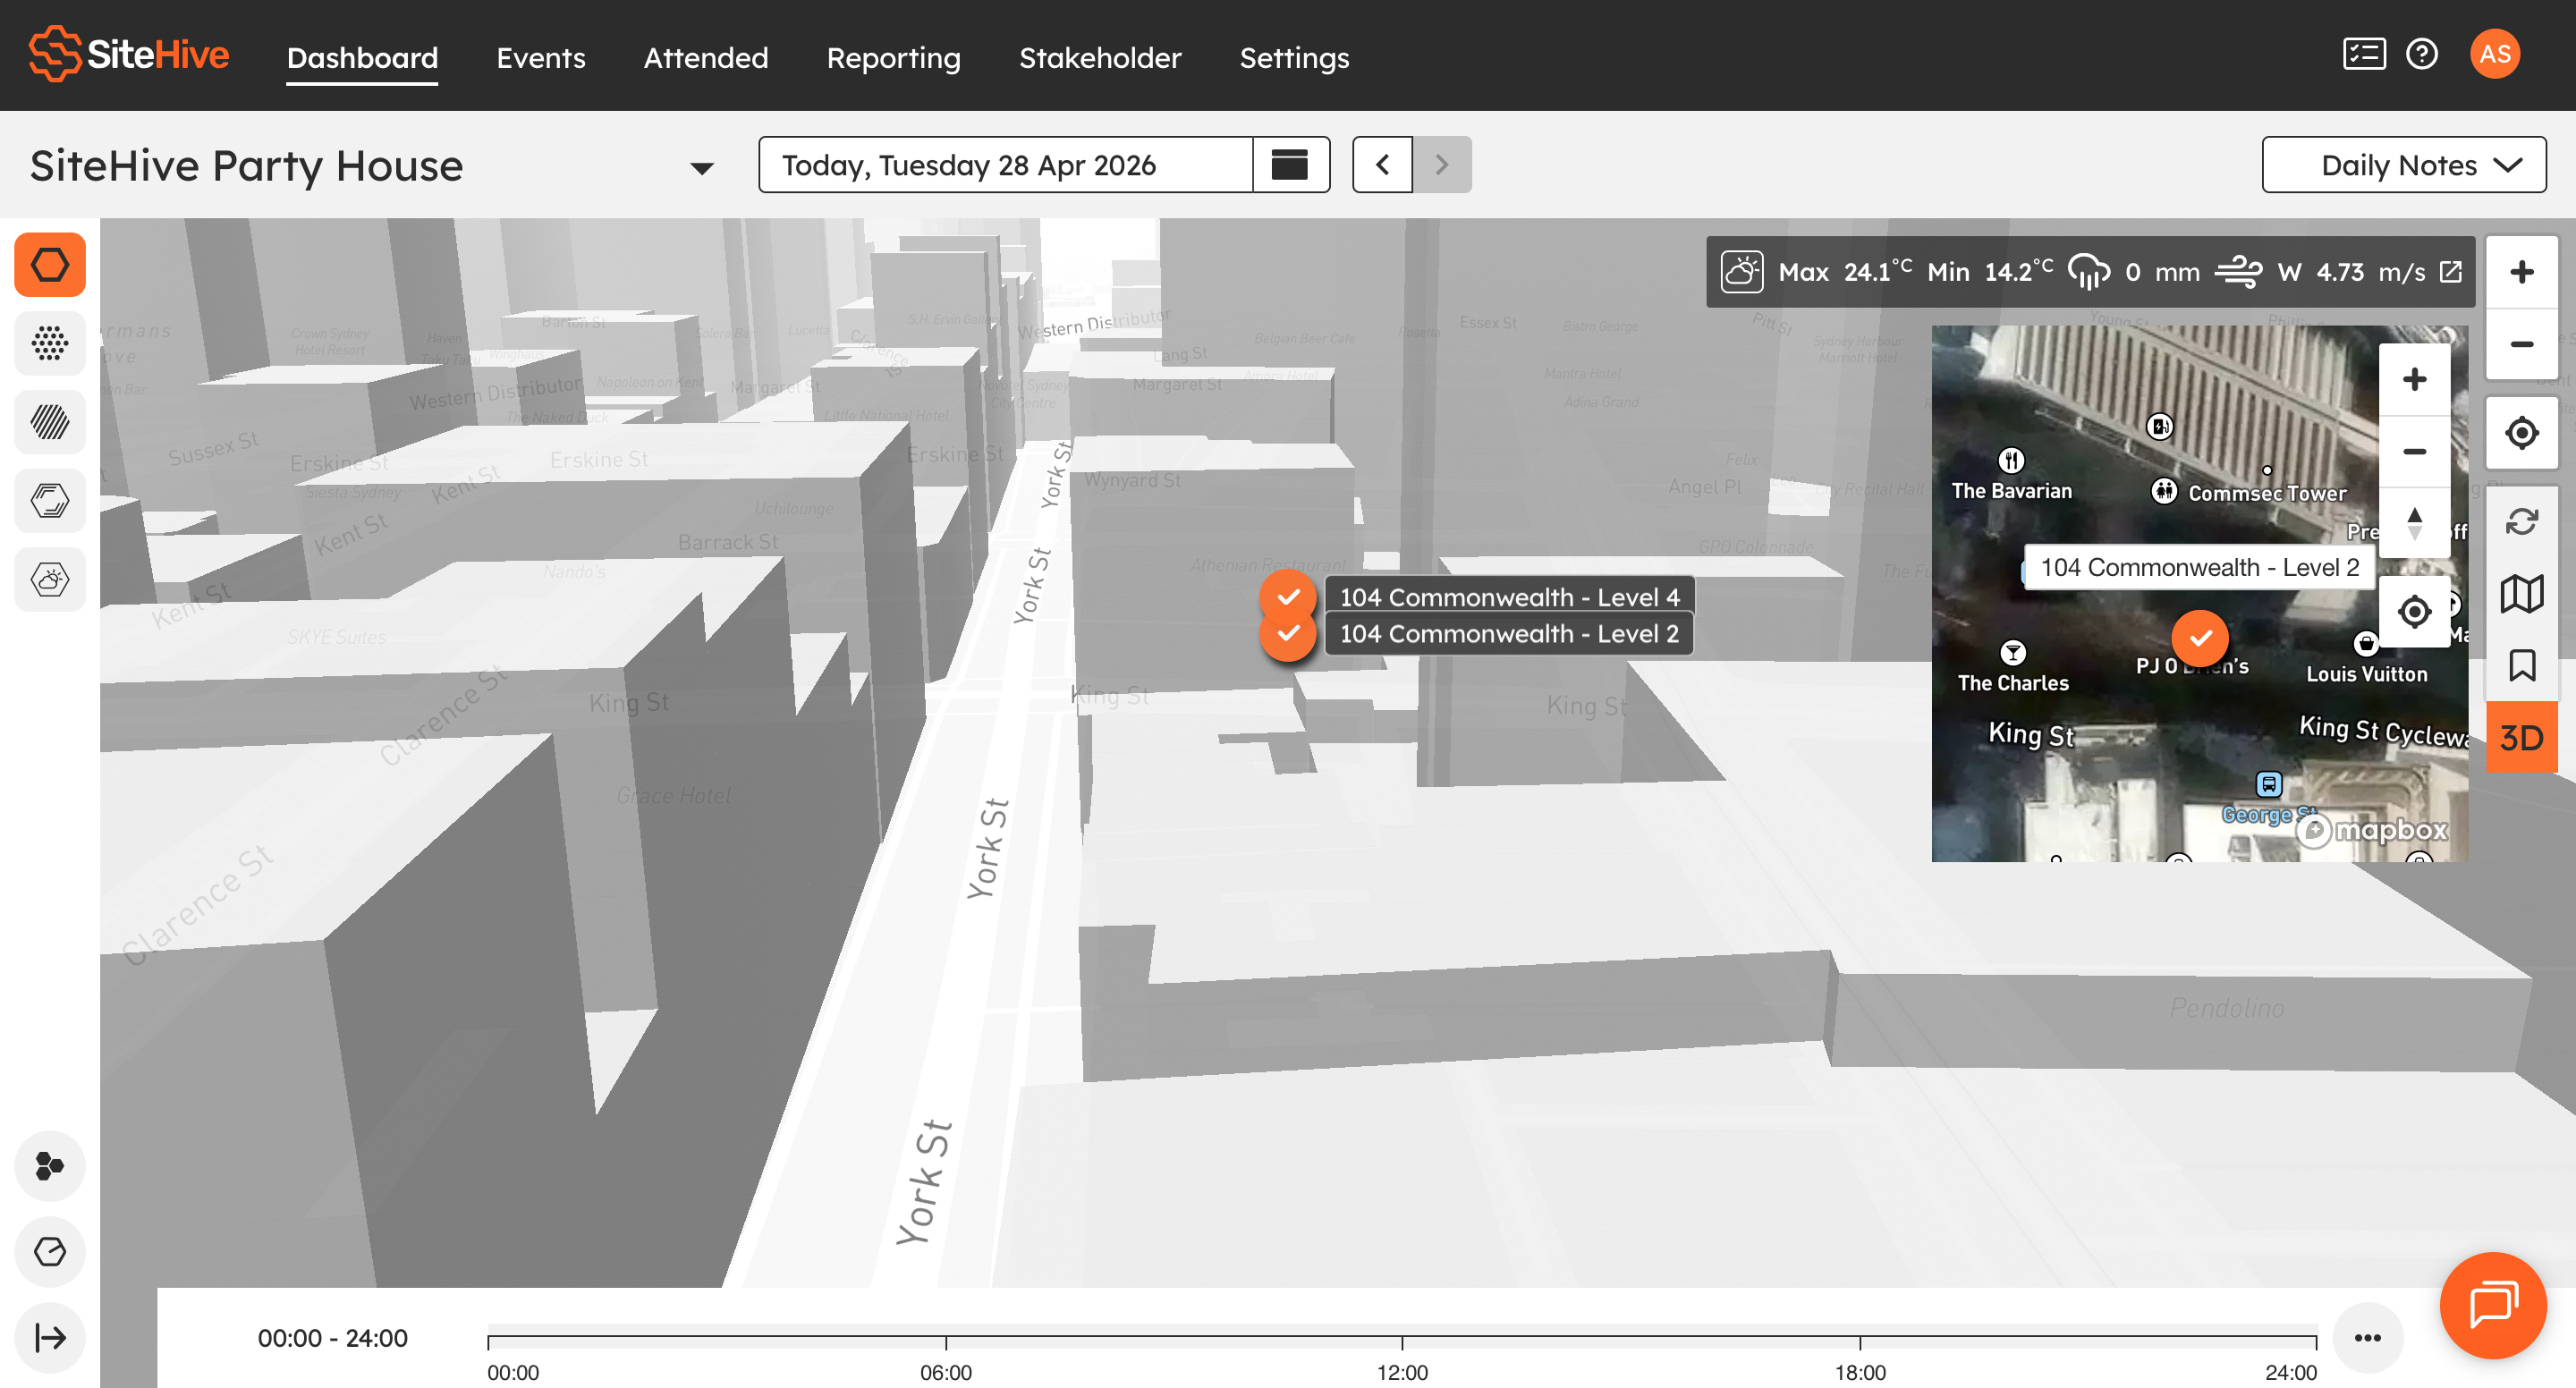
3D building view helps when a flat map does not give enough context, especially on complex or multi-level sites. It lets you:
See Monitoring Points across multiple elevations
Understand exactly where devices sit within buildings
Get clearer spatial context on large or complex sites
Rely less on plans or labels to interpret where a monitor is
It is particularly useful on high-rise, infrastructure and multi-level construction projects.
3D view setup: set monitoring point elevation
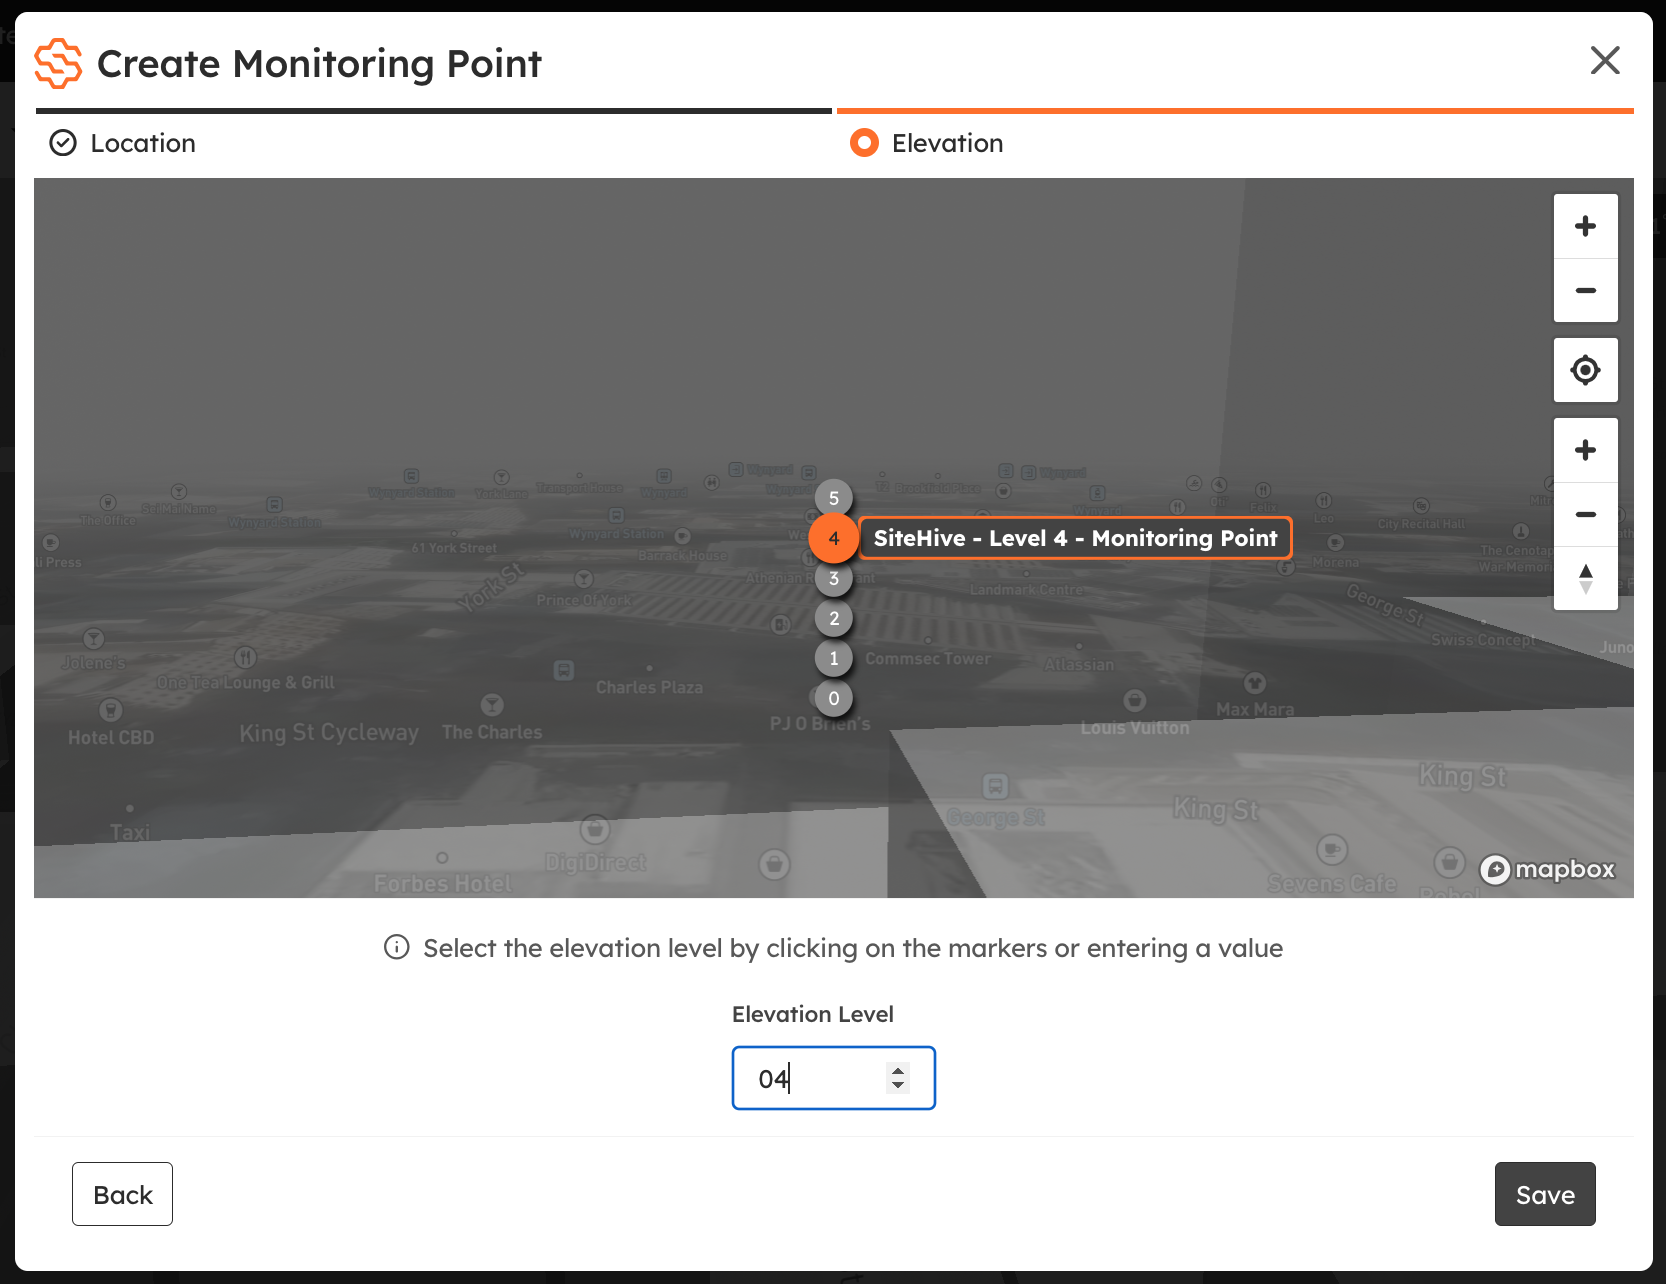
When you create a Monitoring Point on a 3D site there is one extra step: choose its elevation level. Click one of the elevation markers shown on the building, or type the level in.
Level numbering starts at 0 for the underground level and 1 for the ground floor, then 2, 3 and up for each floor above.
Viewing Maps in 3D
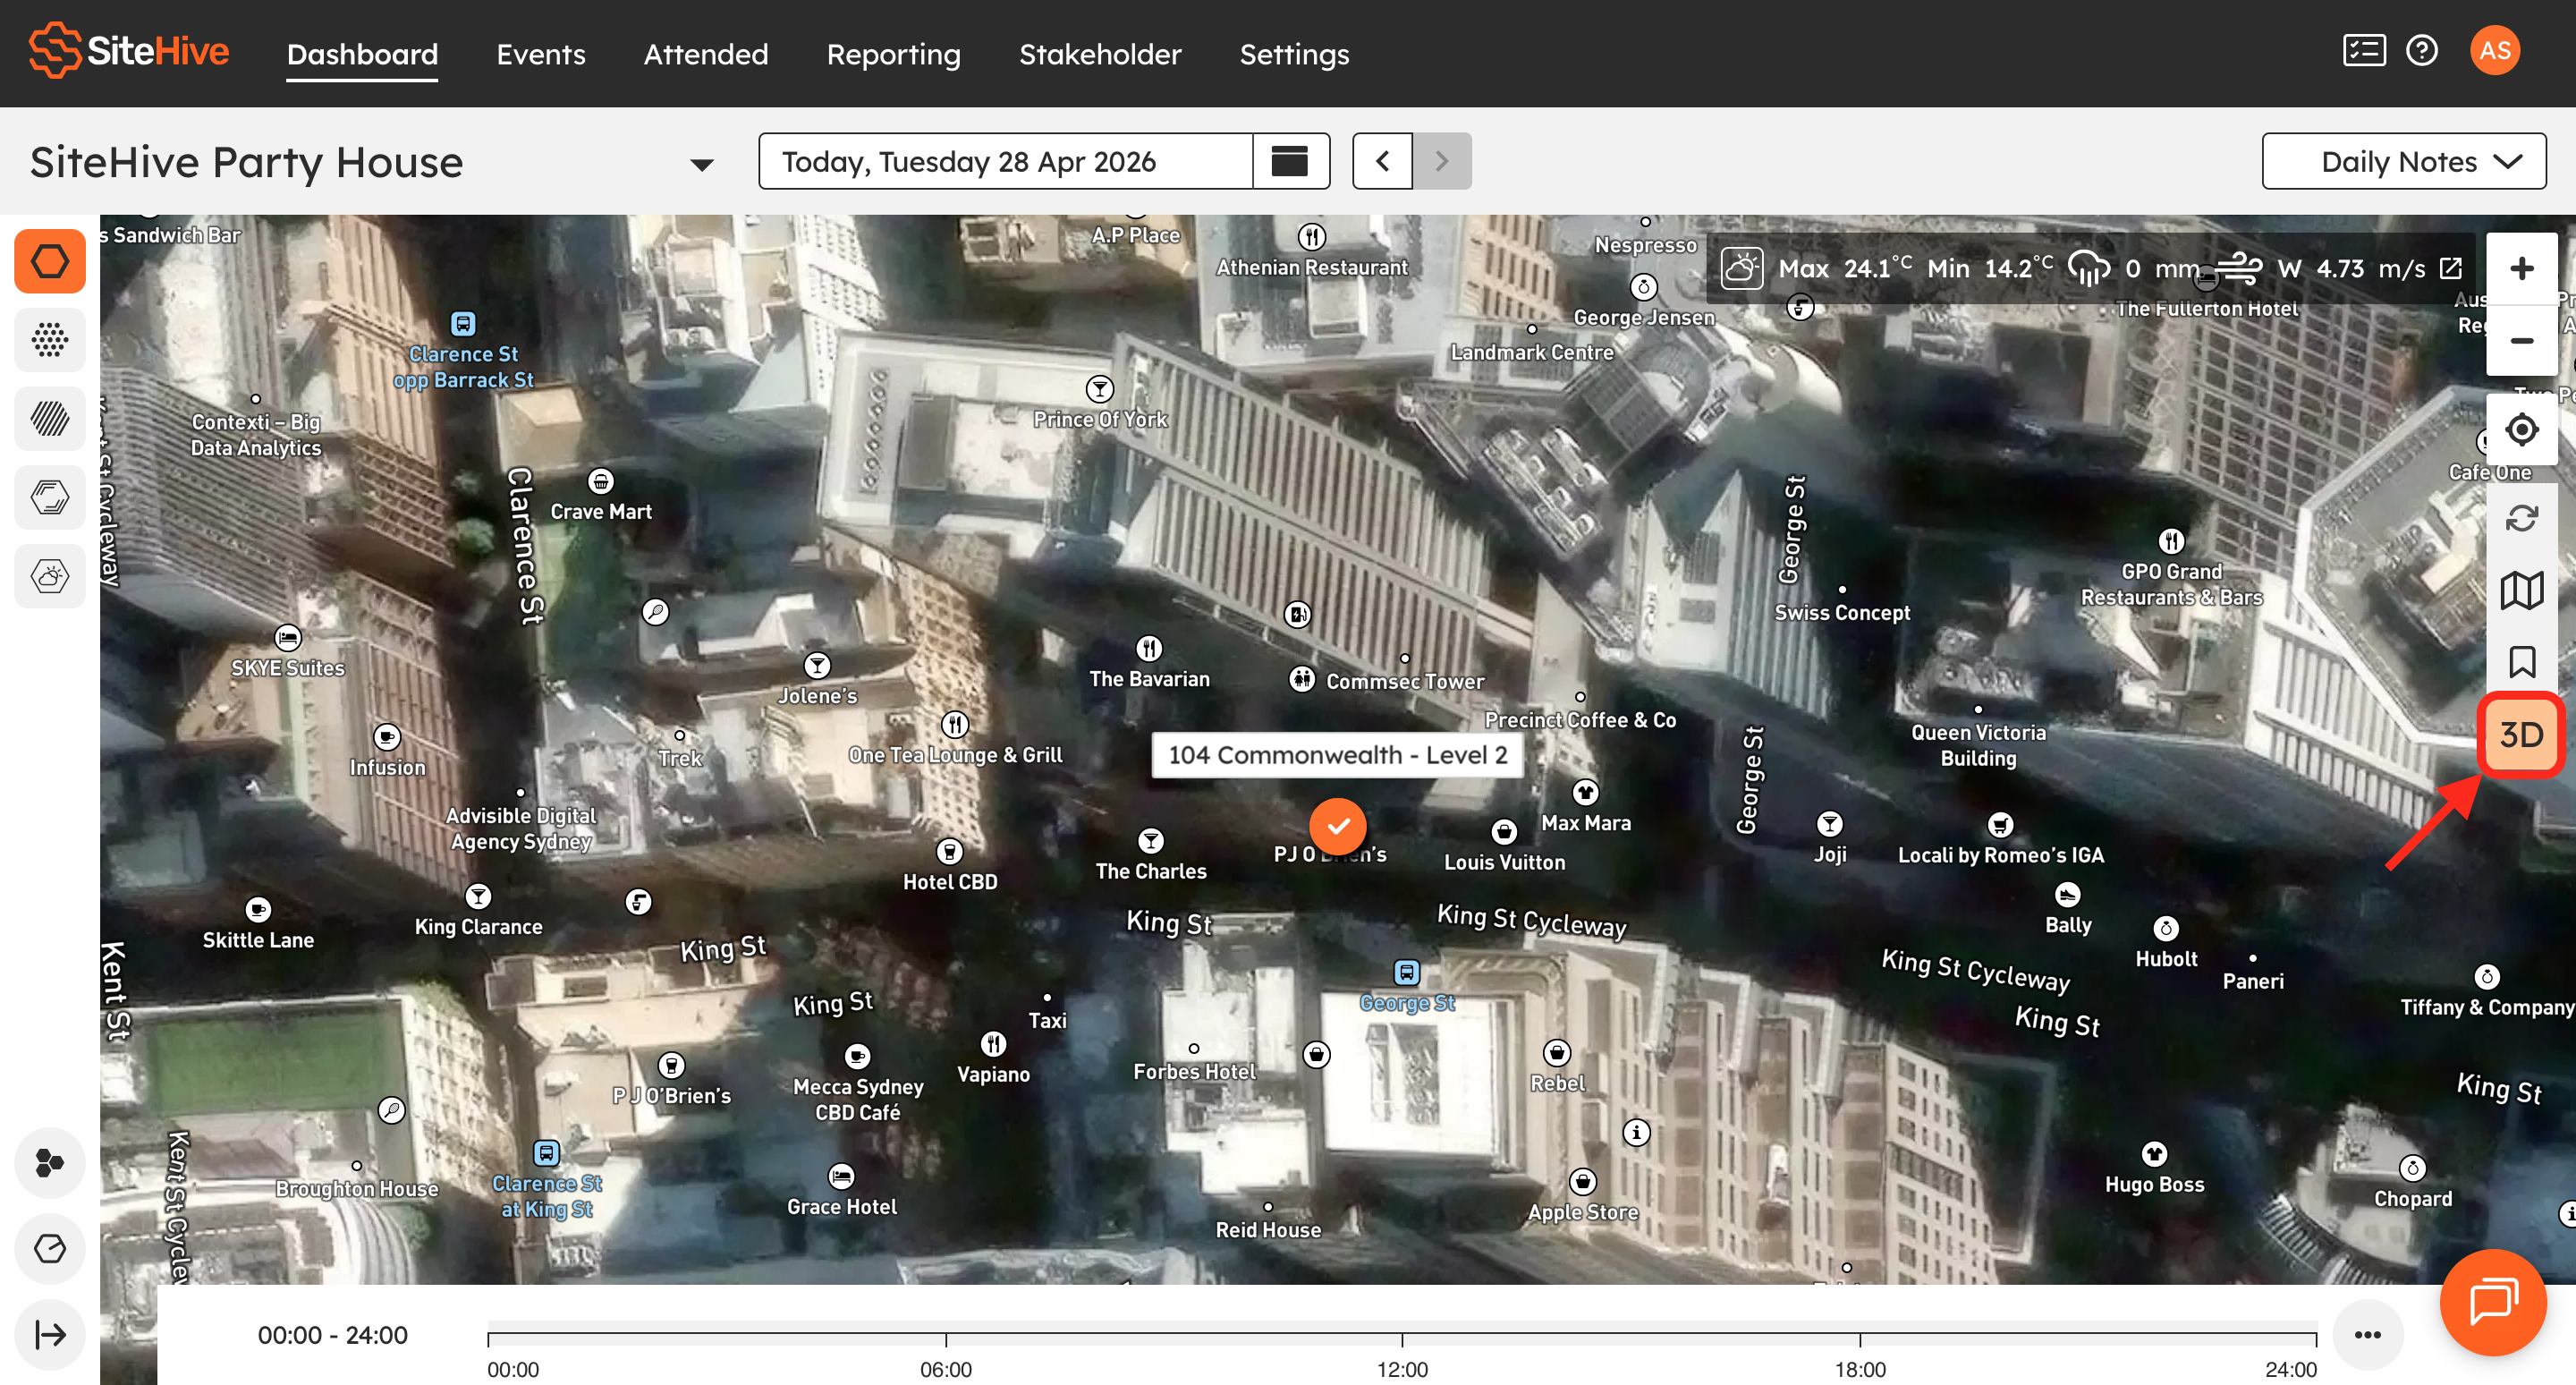
On the Dashboard, switch between the 2D and 3D views with the 3D button at the right-hand edge of the map.
In 3D mode, Monitoring Points are shown against the building structures, so you can see both their vertical and horizontal positions.
Everything you see in 2D is still there, including:
Live measurement readings
Direction of Arrival (DoA) for Monitoring Points with a noise or dust device
You keep full real-time visibility, with better spatial context.
Availability
3D building view is available on request for SiteHive Enviro and SiteHive Enviro Pro sites. Contact your Regional Success Manager or support@sitehive.com to have it switched on for your project.
ℹ️ 3D building view is in beta: details may change, and we would like to hear how it works on your site. Send feedback to support@sitehive.com or through live chat on the Dashboard.
What's next
What is a Monitoring Point? (the location your devices and data attach to)
Dashboard overview (the live map and everything around it)
Add survey and aerial maps (drone surveys and aerial imagery under your Monitoring Points)