
Dashboard overview
The SiteHive Enviro Dashboard is your 24-hour view of everything happening on your site. This page is a tour of its key elements.
Overview
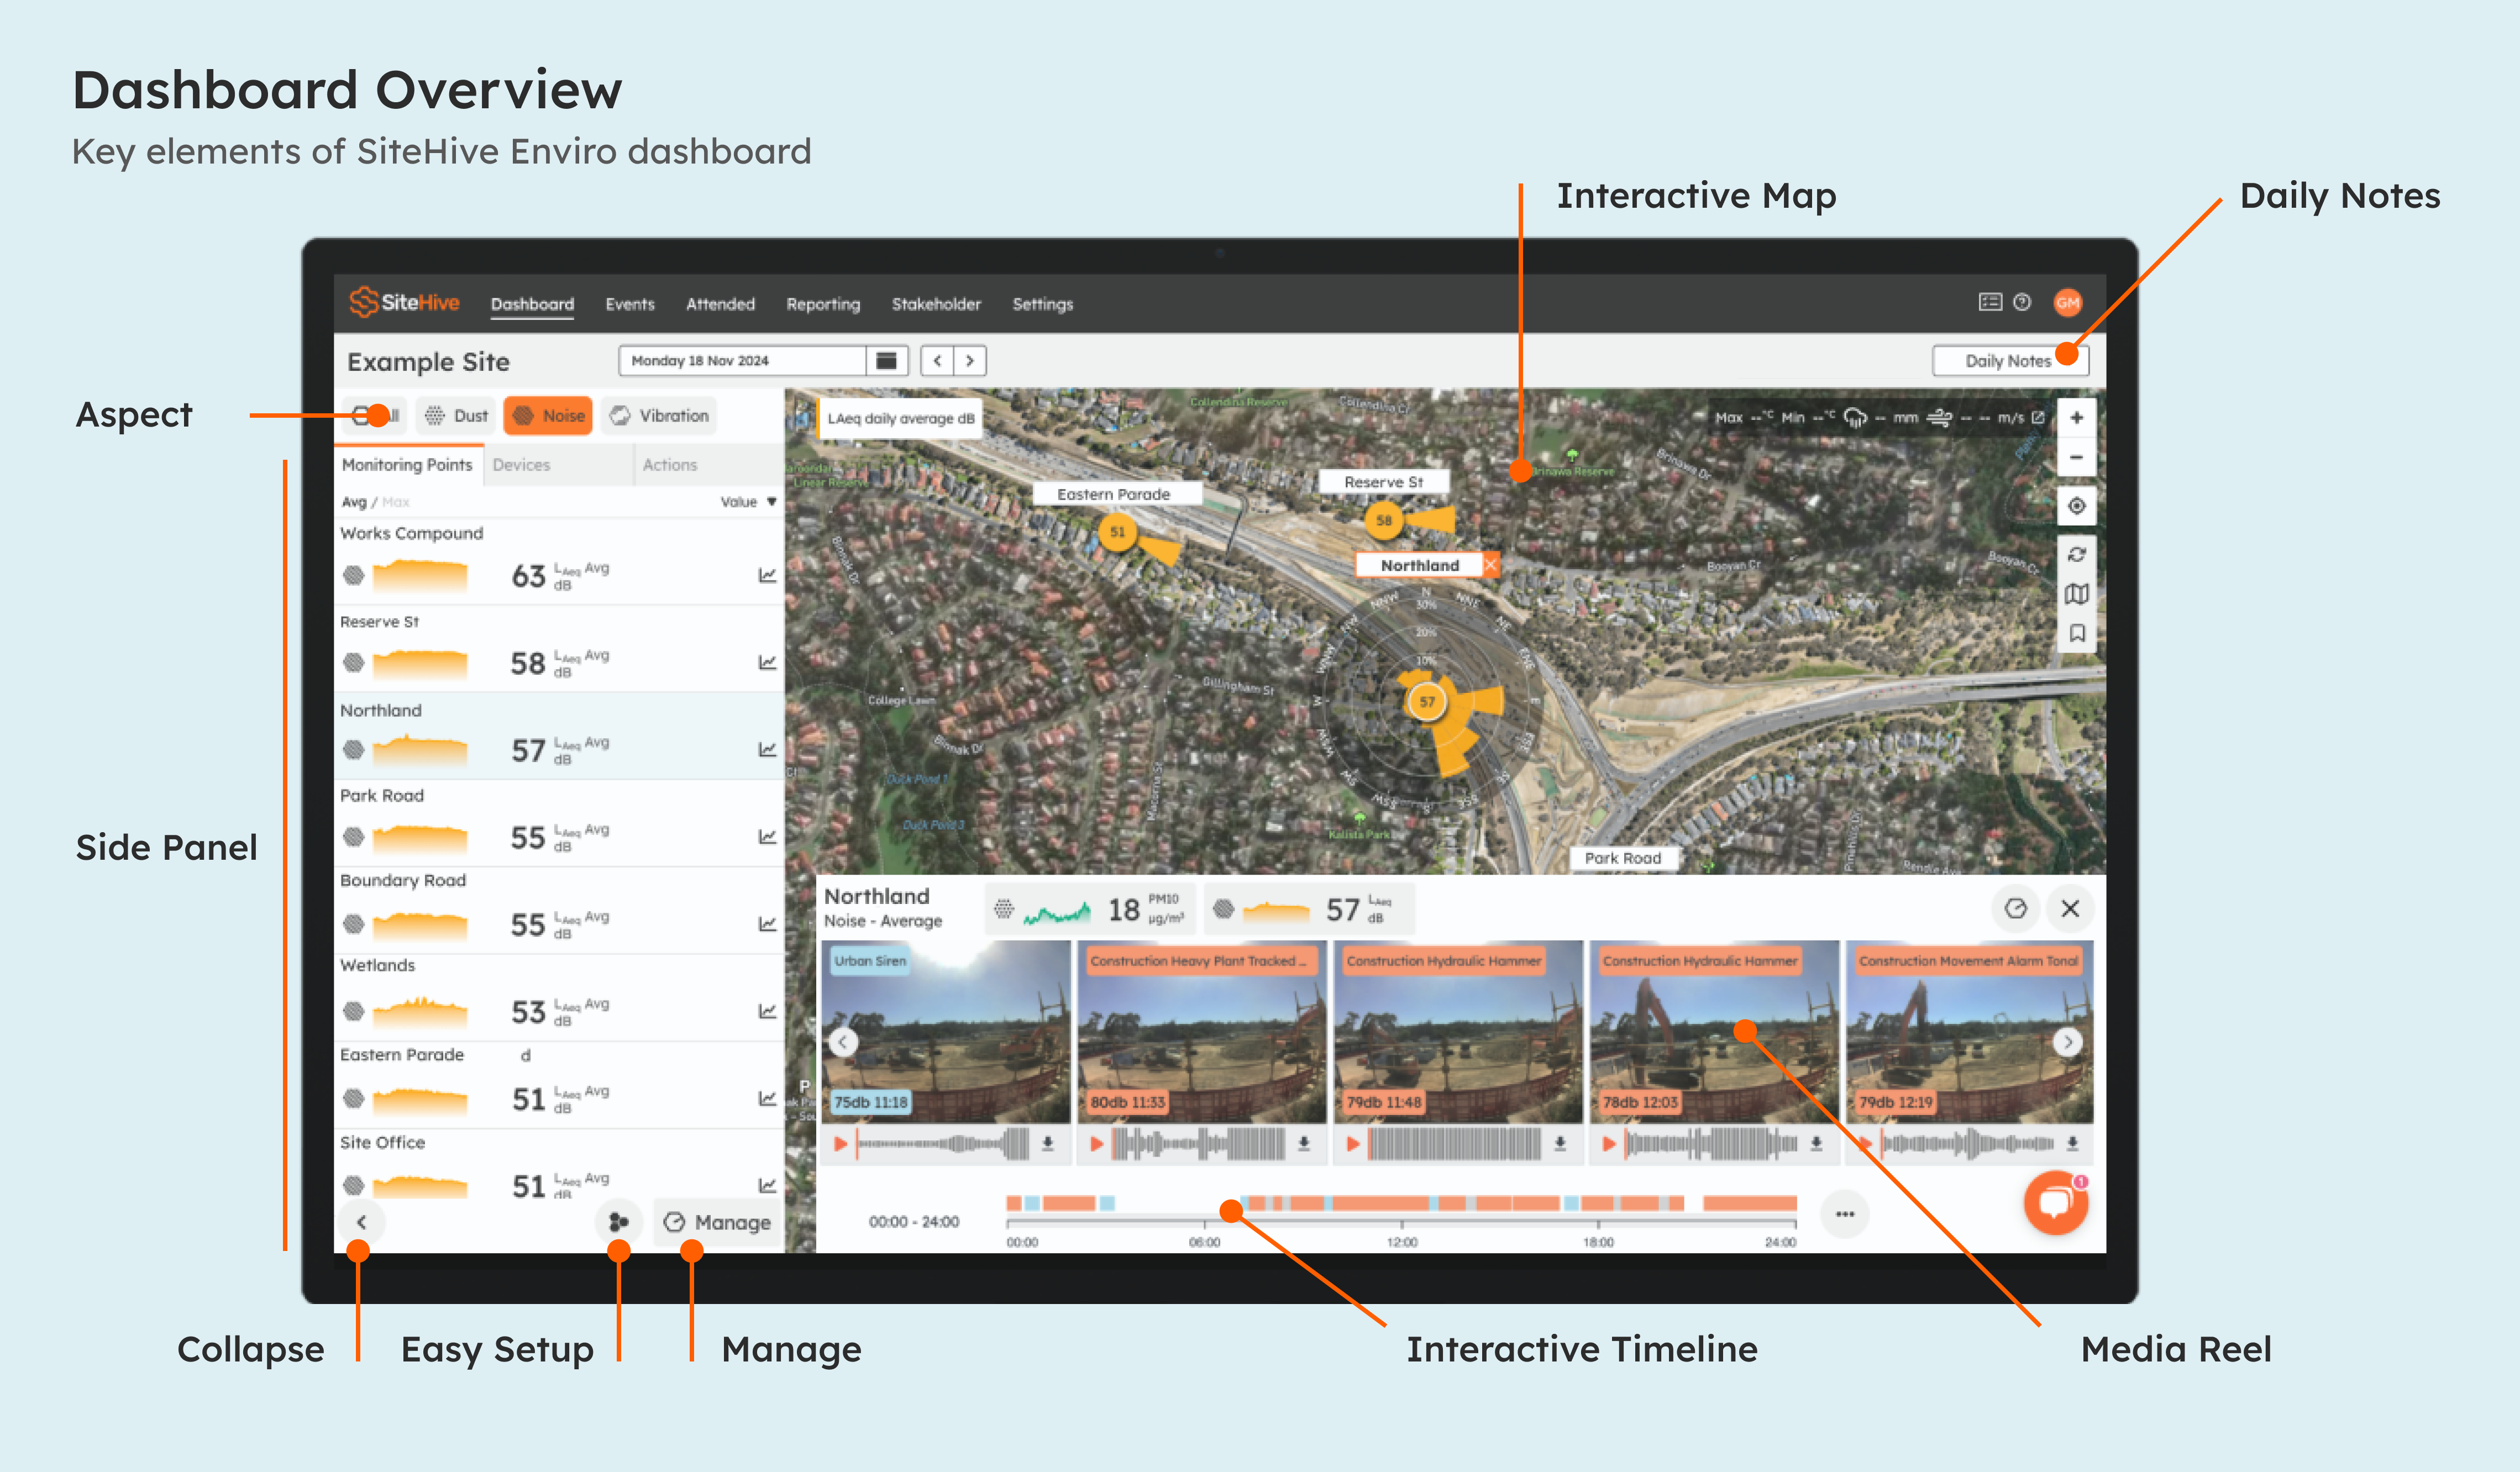
The dashboard presents all the information you are used to, and it is designed as a 24-hour view of your site. Here are the key elements:
Status & Data on Maps
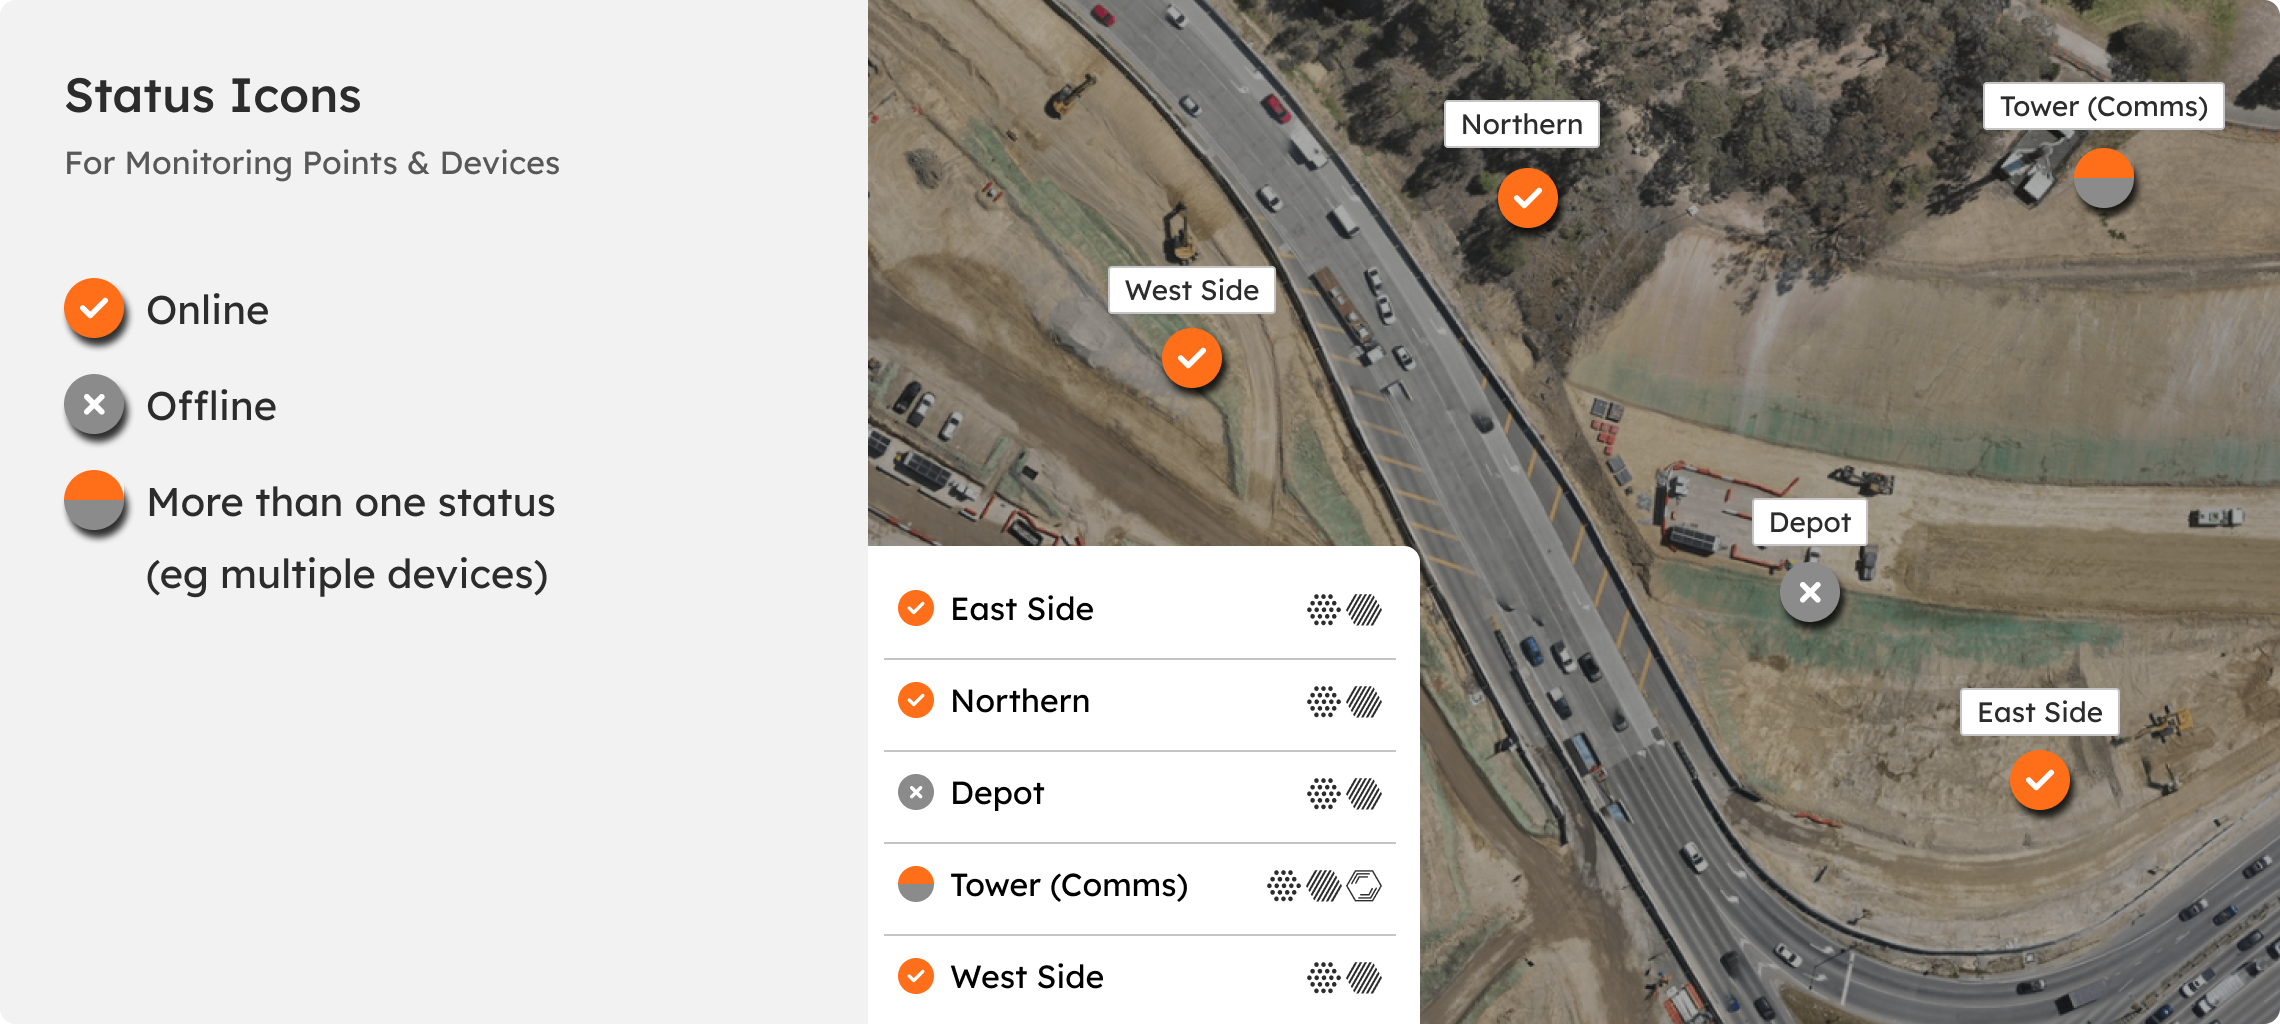
The maps on the dashboard have been enhanced to directly show data in each location, and they are linked to the aspect you select. In the 'All Aspects' view, you can see the status of all Monitoring Points (are devices online as expected), making it easy to quickly identify if anything is not how it should be.
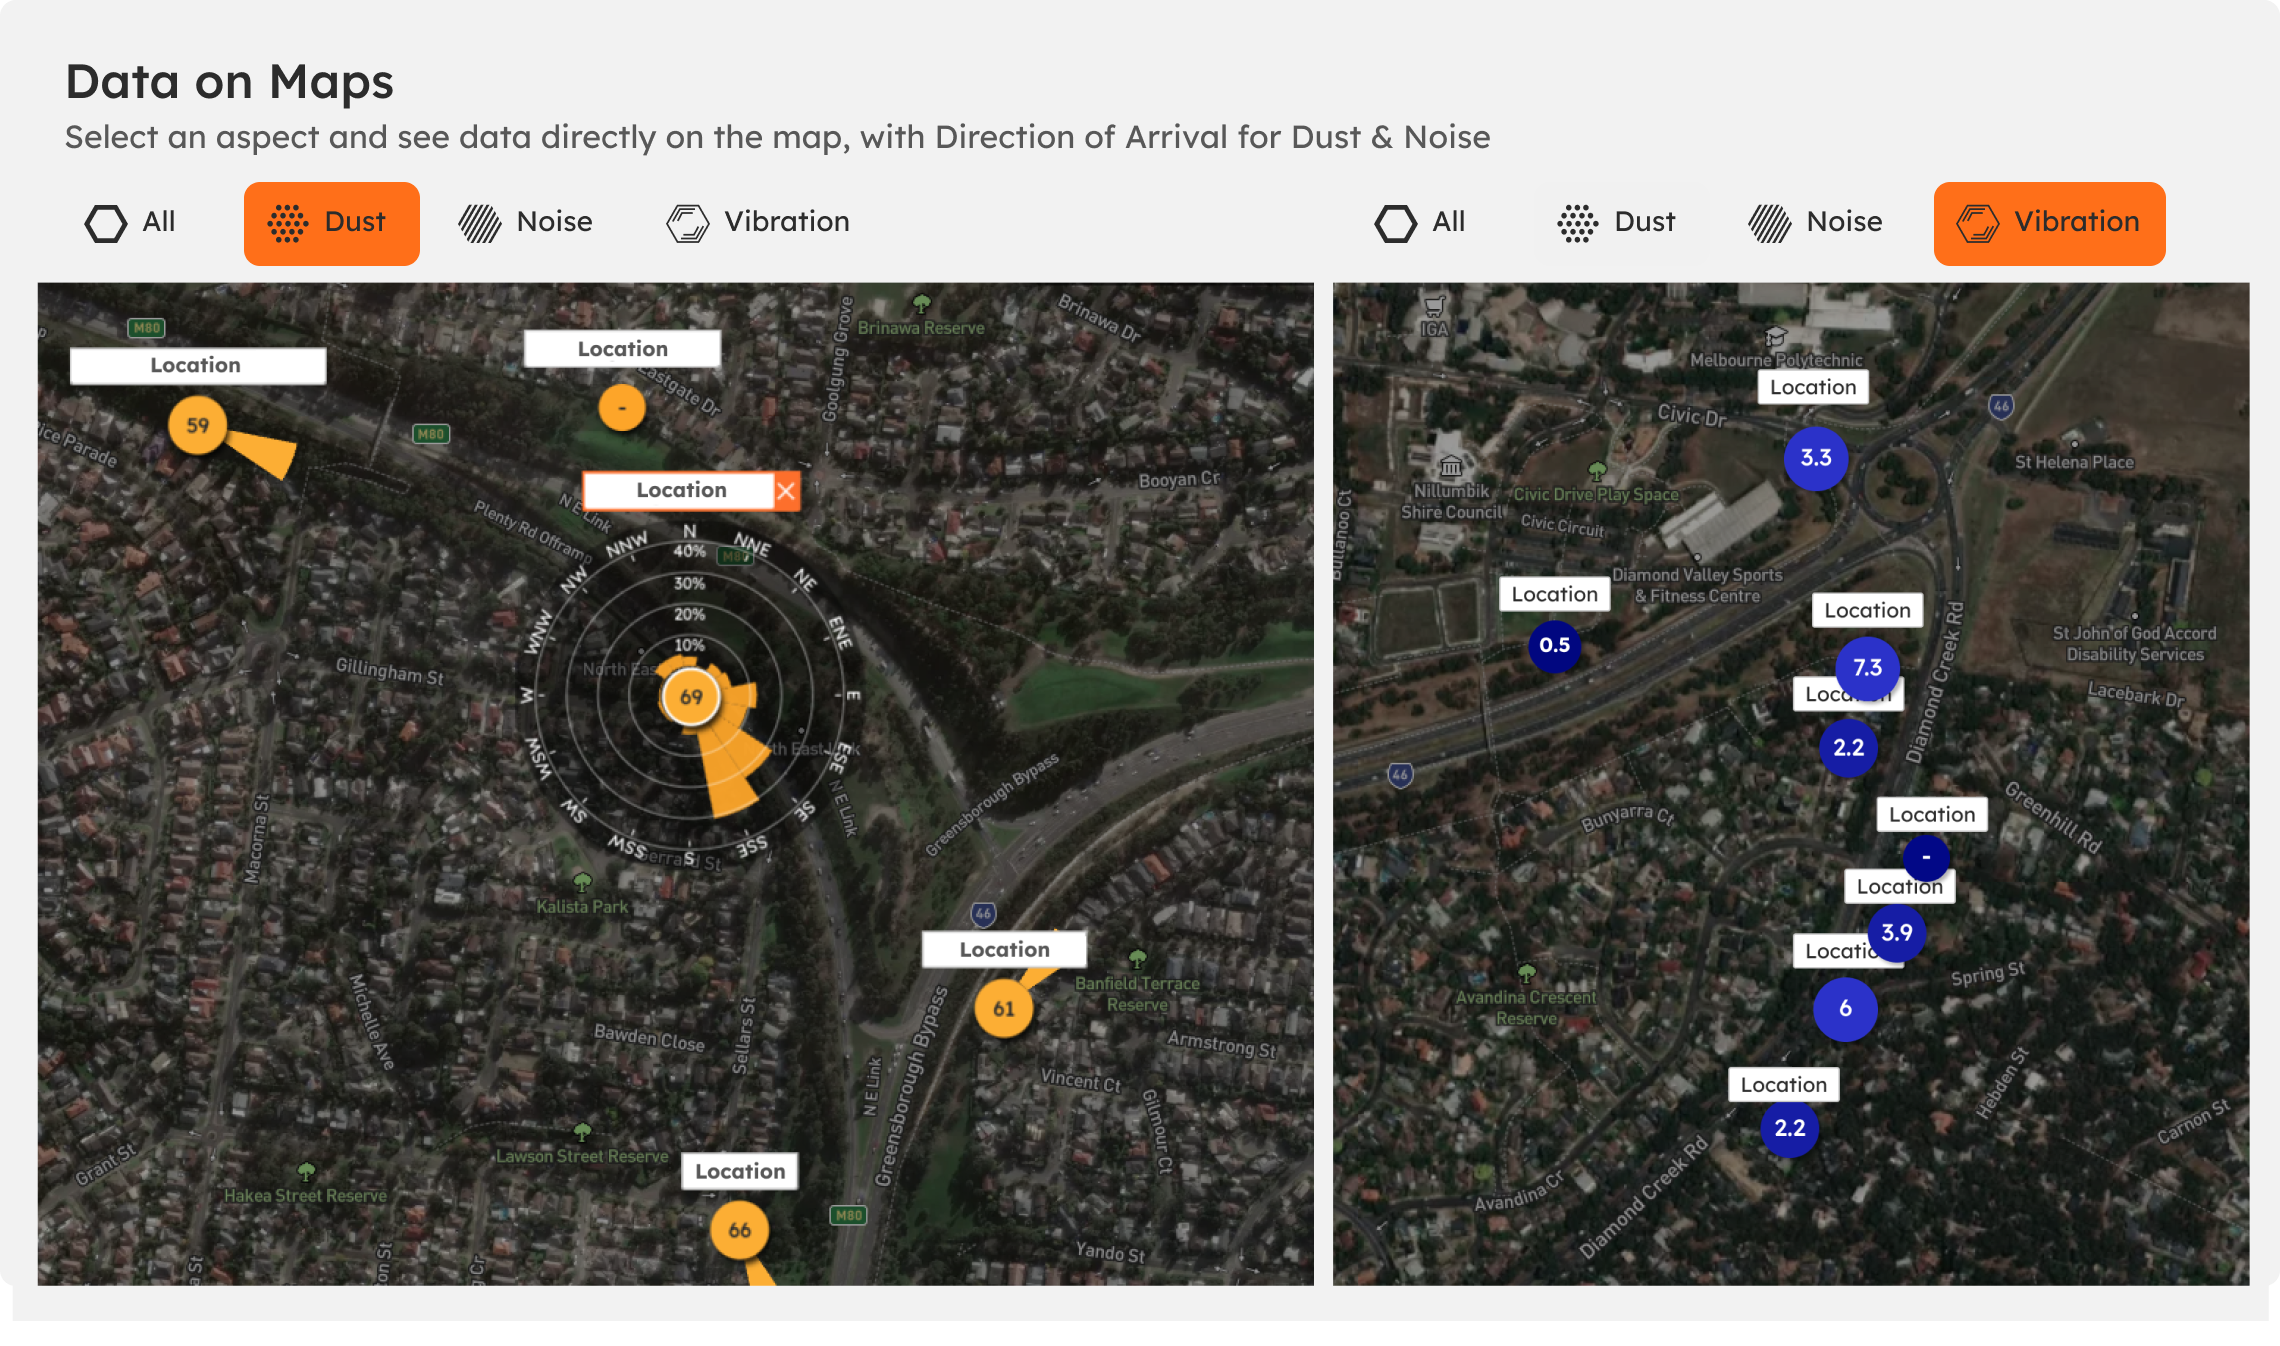
When an aspect is chosen, the map updates to display data values at the monitoring locations for that aspect. For example, if Vibration is selected, the default readings across the map are the latest vSum values for the site.
For aspects that have Direction of Arrival data (Noise, Dust) the primary direction is indicated on the map, and when a Monitoring Point is selected the detailed visualisation with the percentage breakdown is shown at that location: see Direction of Arrival.
SiteHive Enviro Pro adds more to the map: Add survey and aerial maps (a drone survey as the basemap), Add KML map layers (your own boundaries and alignments) and 3D building view (beta) (Monitoring Points by building level).
Side Panel
The Side Panel is your go-to hub for managing everything. Here's where you can select your aspect, see Monitoring Points or devices, access actions, and see and sort data.
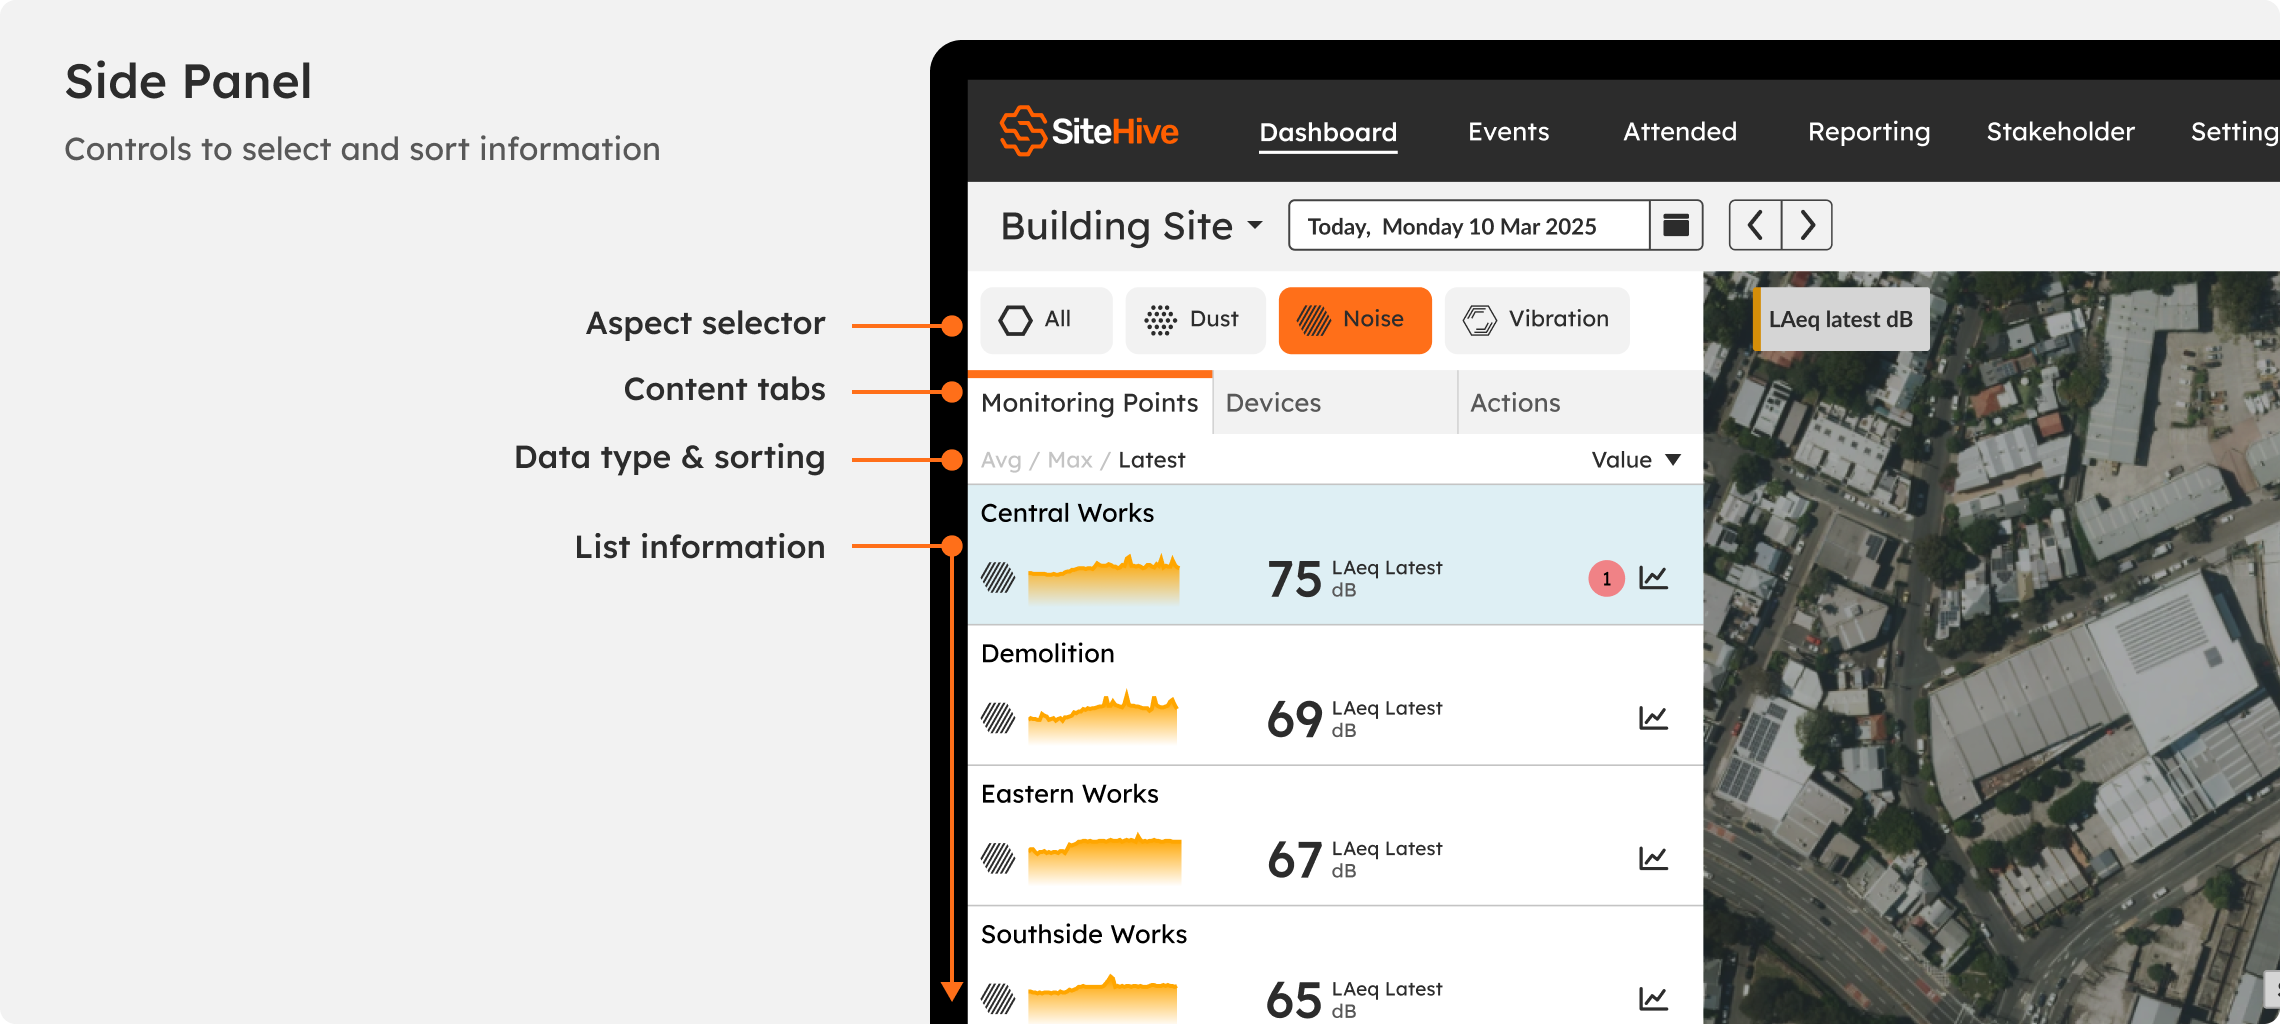
View Monitoring Points: instantly access real-time dust, noise, and vibration data, all in one spot.
Manage Devices: quickly check the status of your hardware to ensure everything's running smoothly.
Use Action Shortcuts: get things done in one click, whether it's viewing a graph or changing a setting.
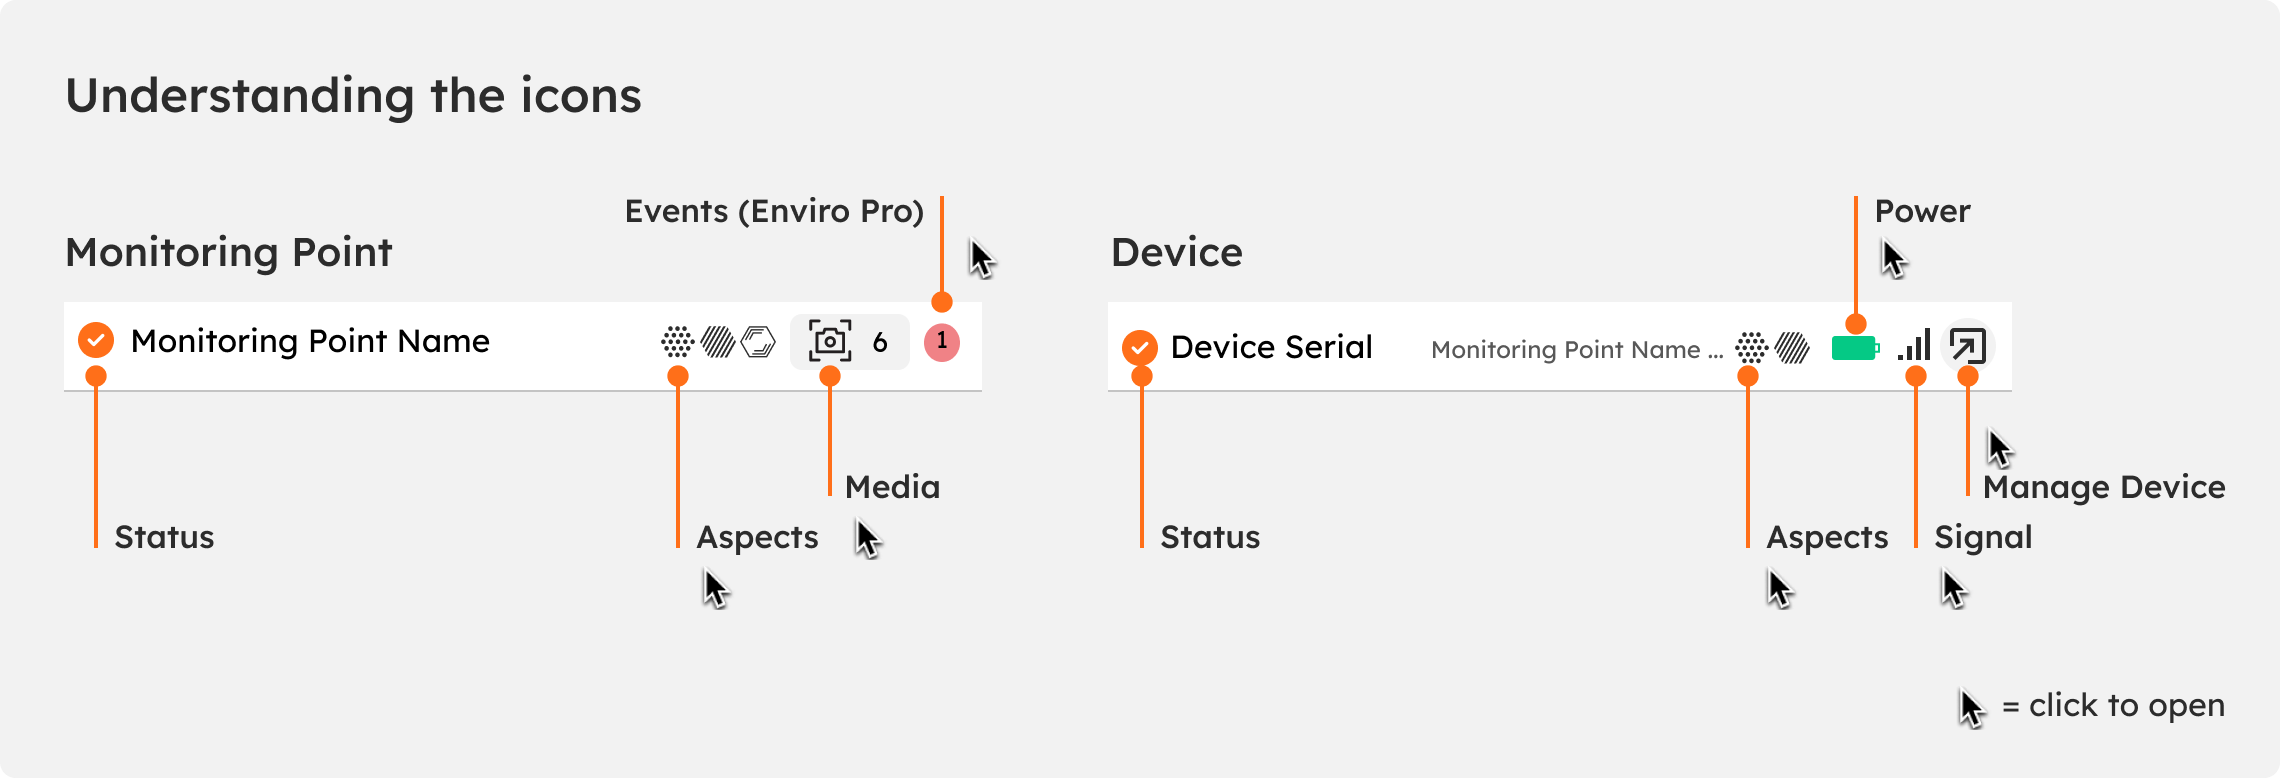
In the side panel you can see a list of Monitoring Points and/or Devices, with a collection of symbols to indicate status. A number of these can be clicked to reveal more information:
Mini Graphs give you instant visual summaries of the data, allowing you to spot trends in a snap.
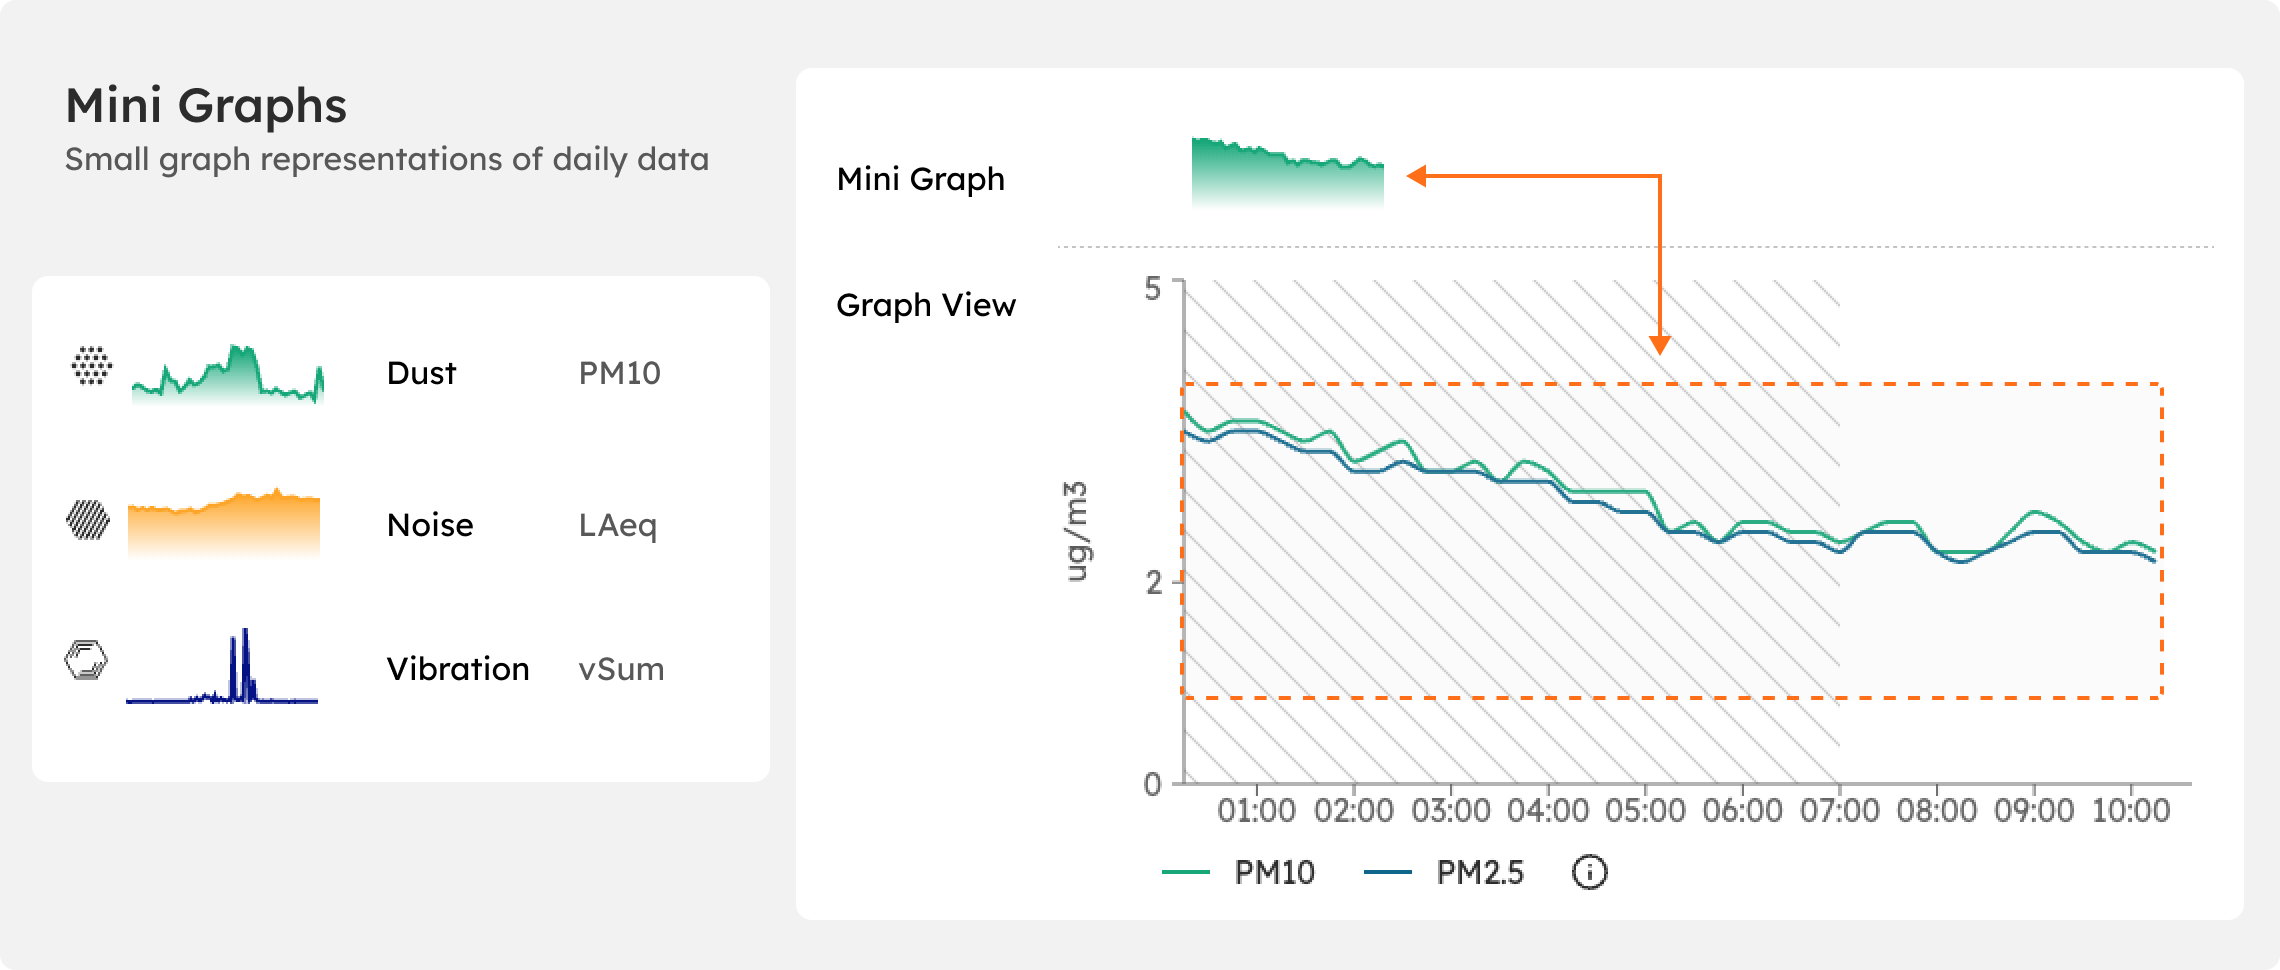
Where to find them: the Mini Graphs are located in the side panel, in the bottom tray when a Monitoring Point is selected.
What you'll see: key values for each metric. They're clickable, so you can quickly dive into detailed data if something looks interesting.
Graph Zoom
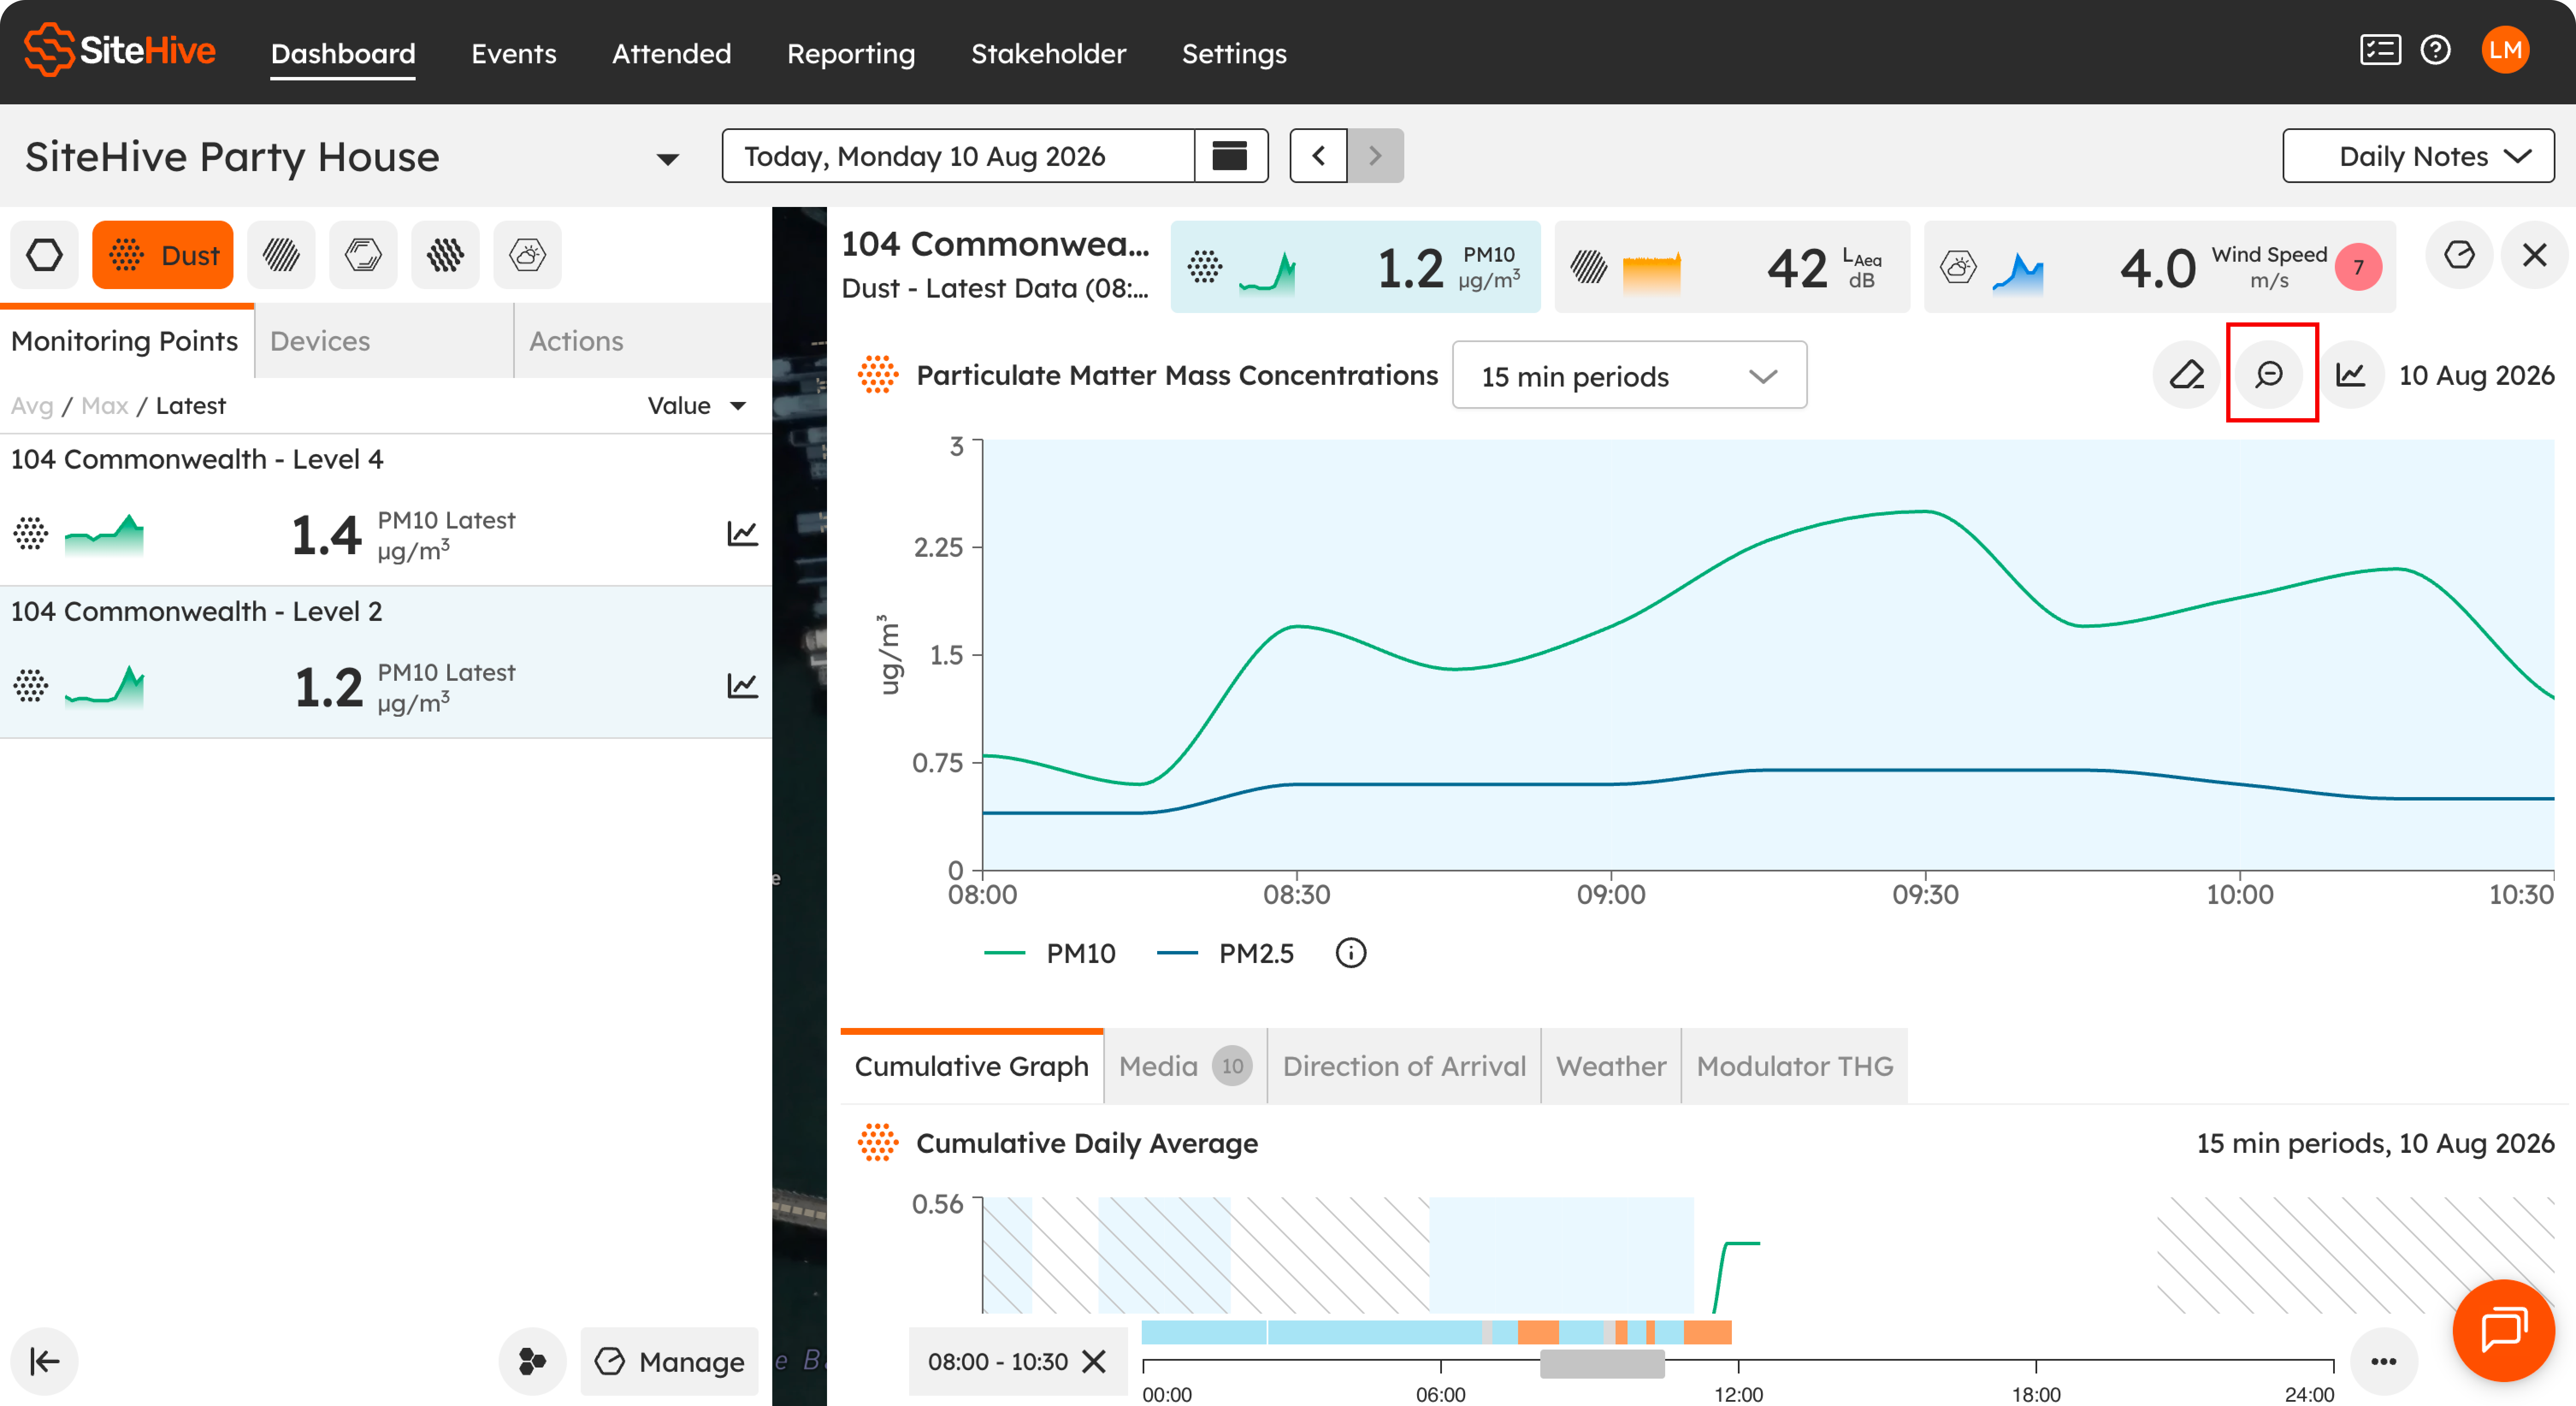
Once you've dived into a detailed graph from the Side Panel, you can get even closer. Just drag across the graph to select the time window you want a better look at, then hit the zoom icon to jump right in.
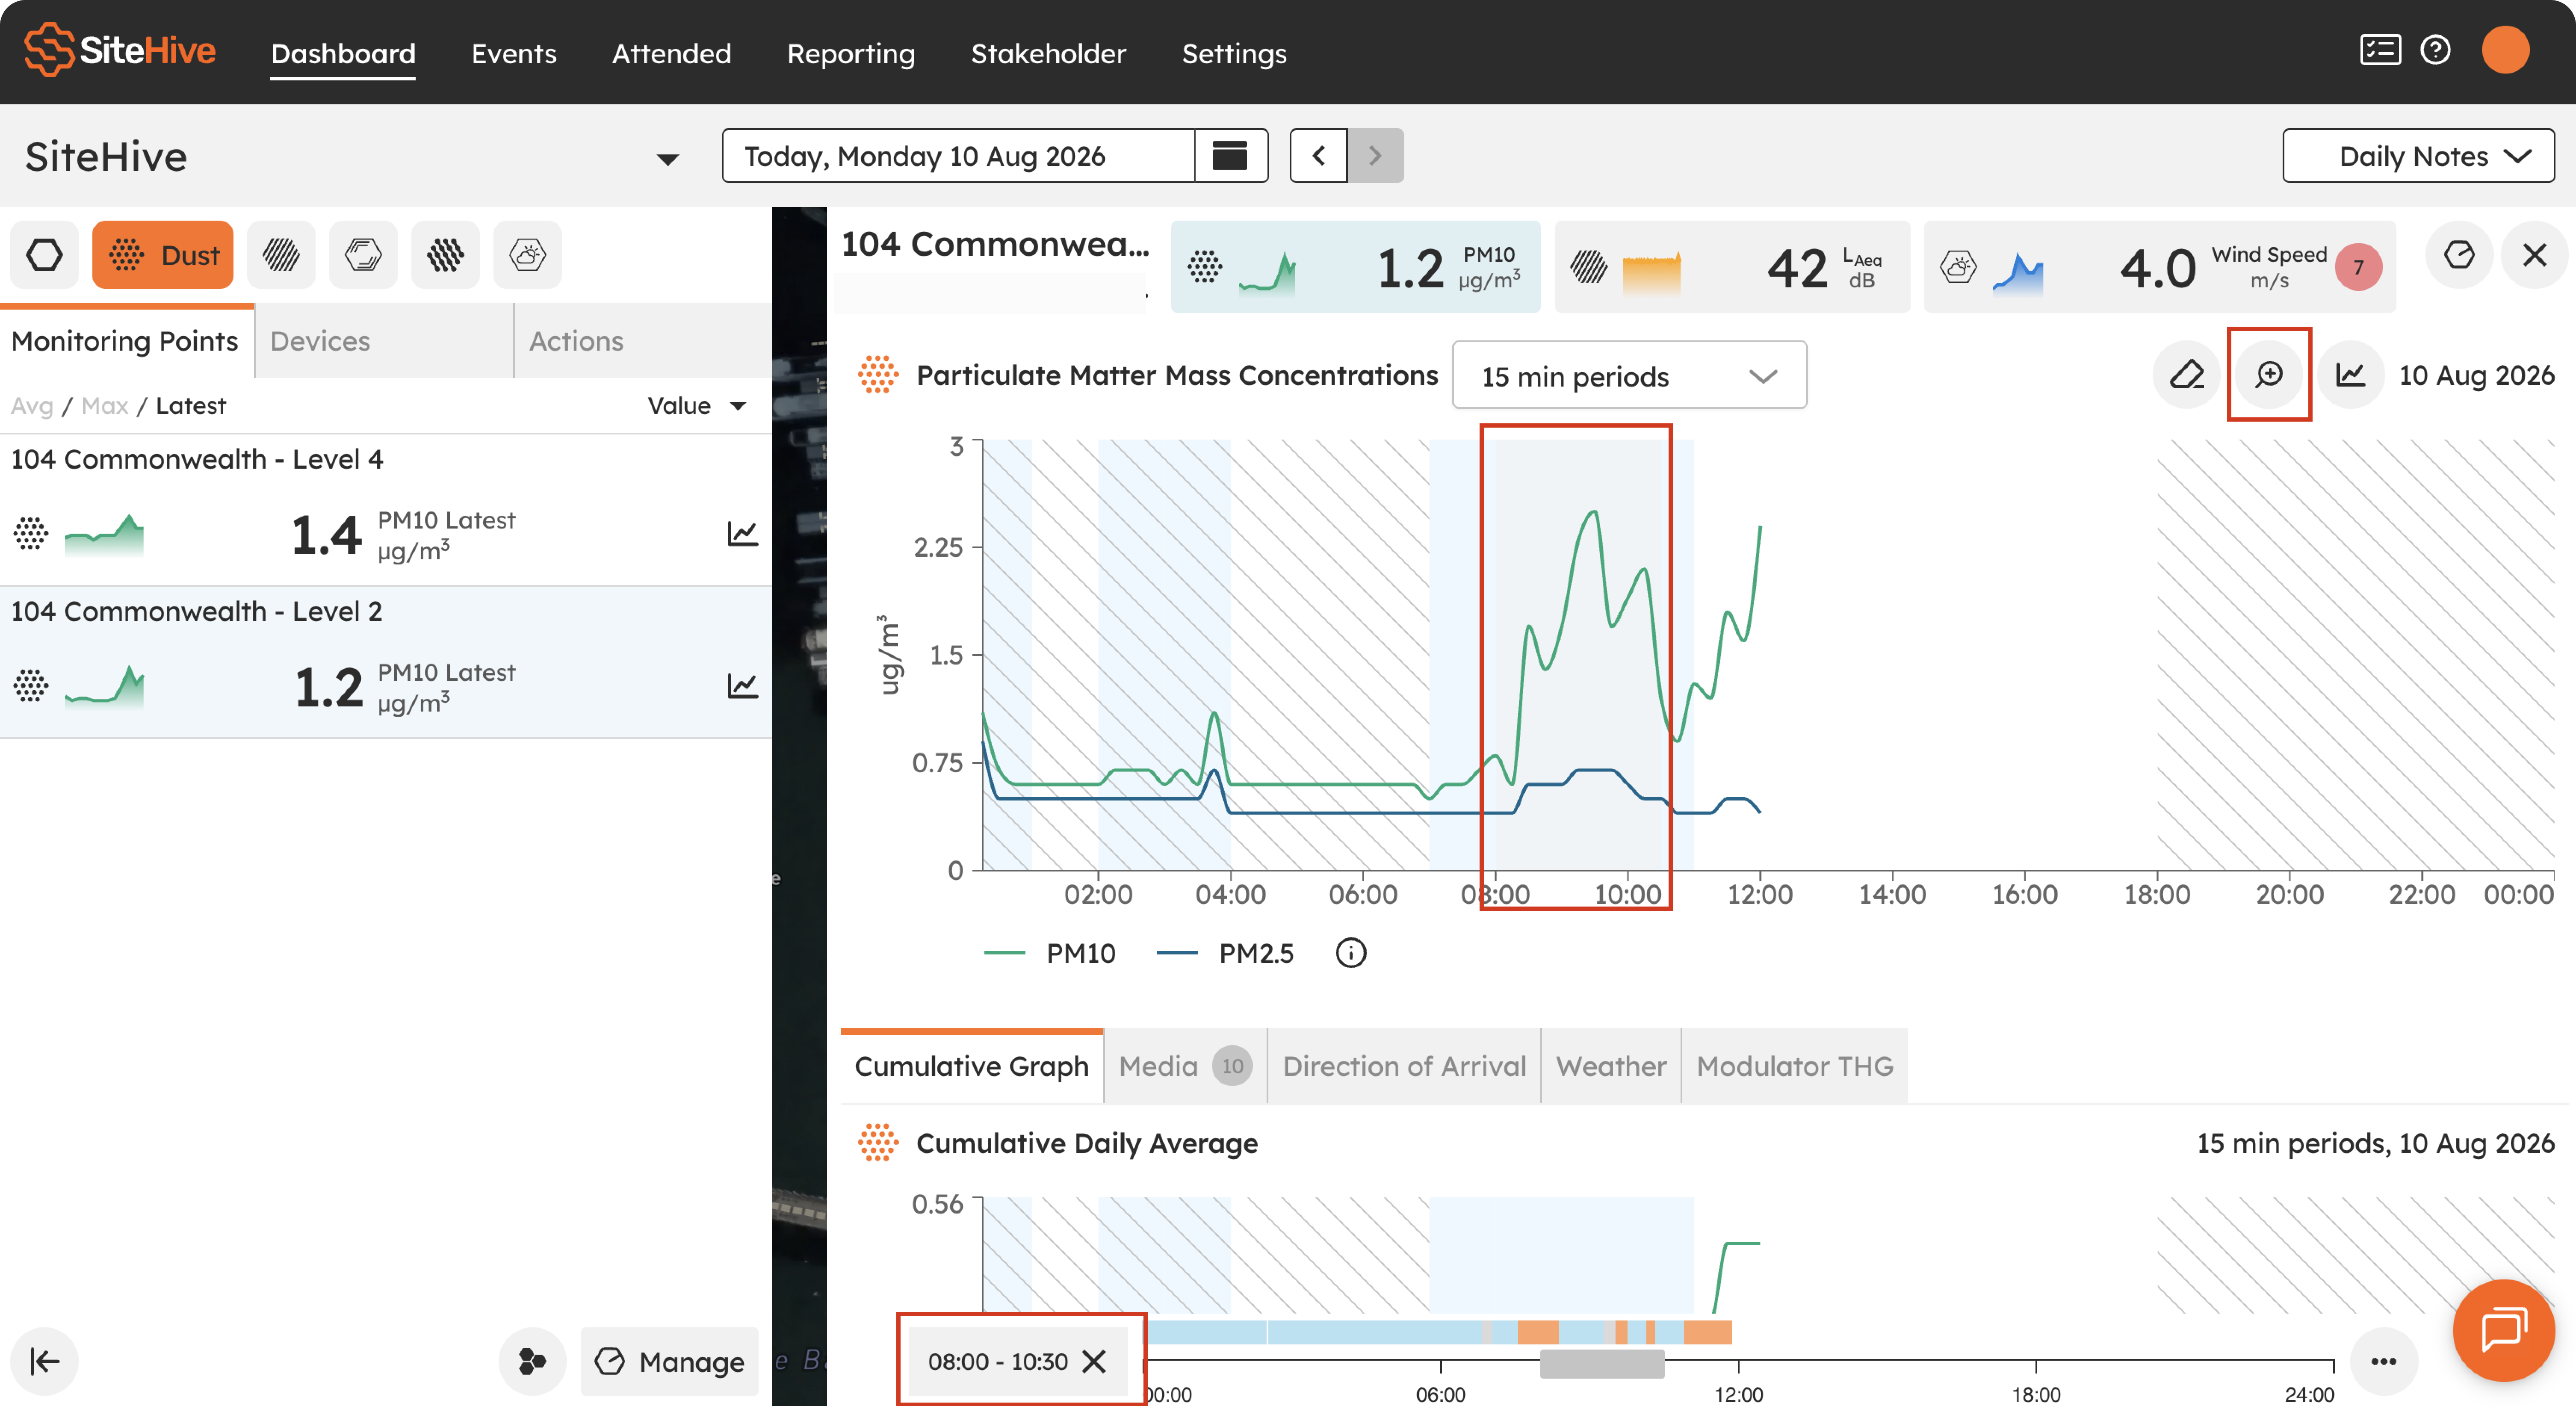
While you're zoomed in, use the timeline below to pan around; drag or resize it and the graph keeps up. Ready to see the bigger picture again? Hit that zoom icon once more to pop back out. Perfect for chasing down a spike or digging into exactly what happened in a specific window.
Actions Tab
The Actions tab is your shortcut to productivity. Everything you need to keep things moving quickly is right here:
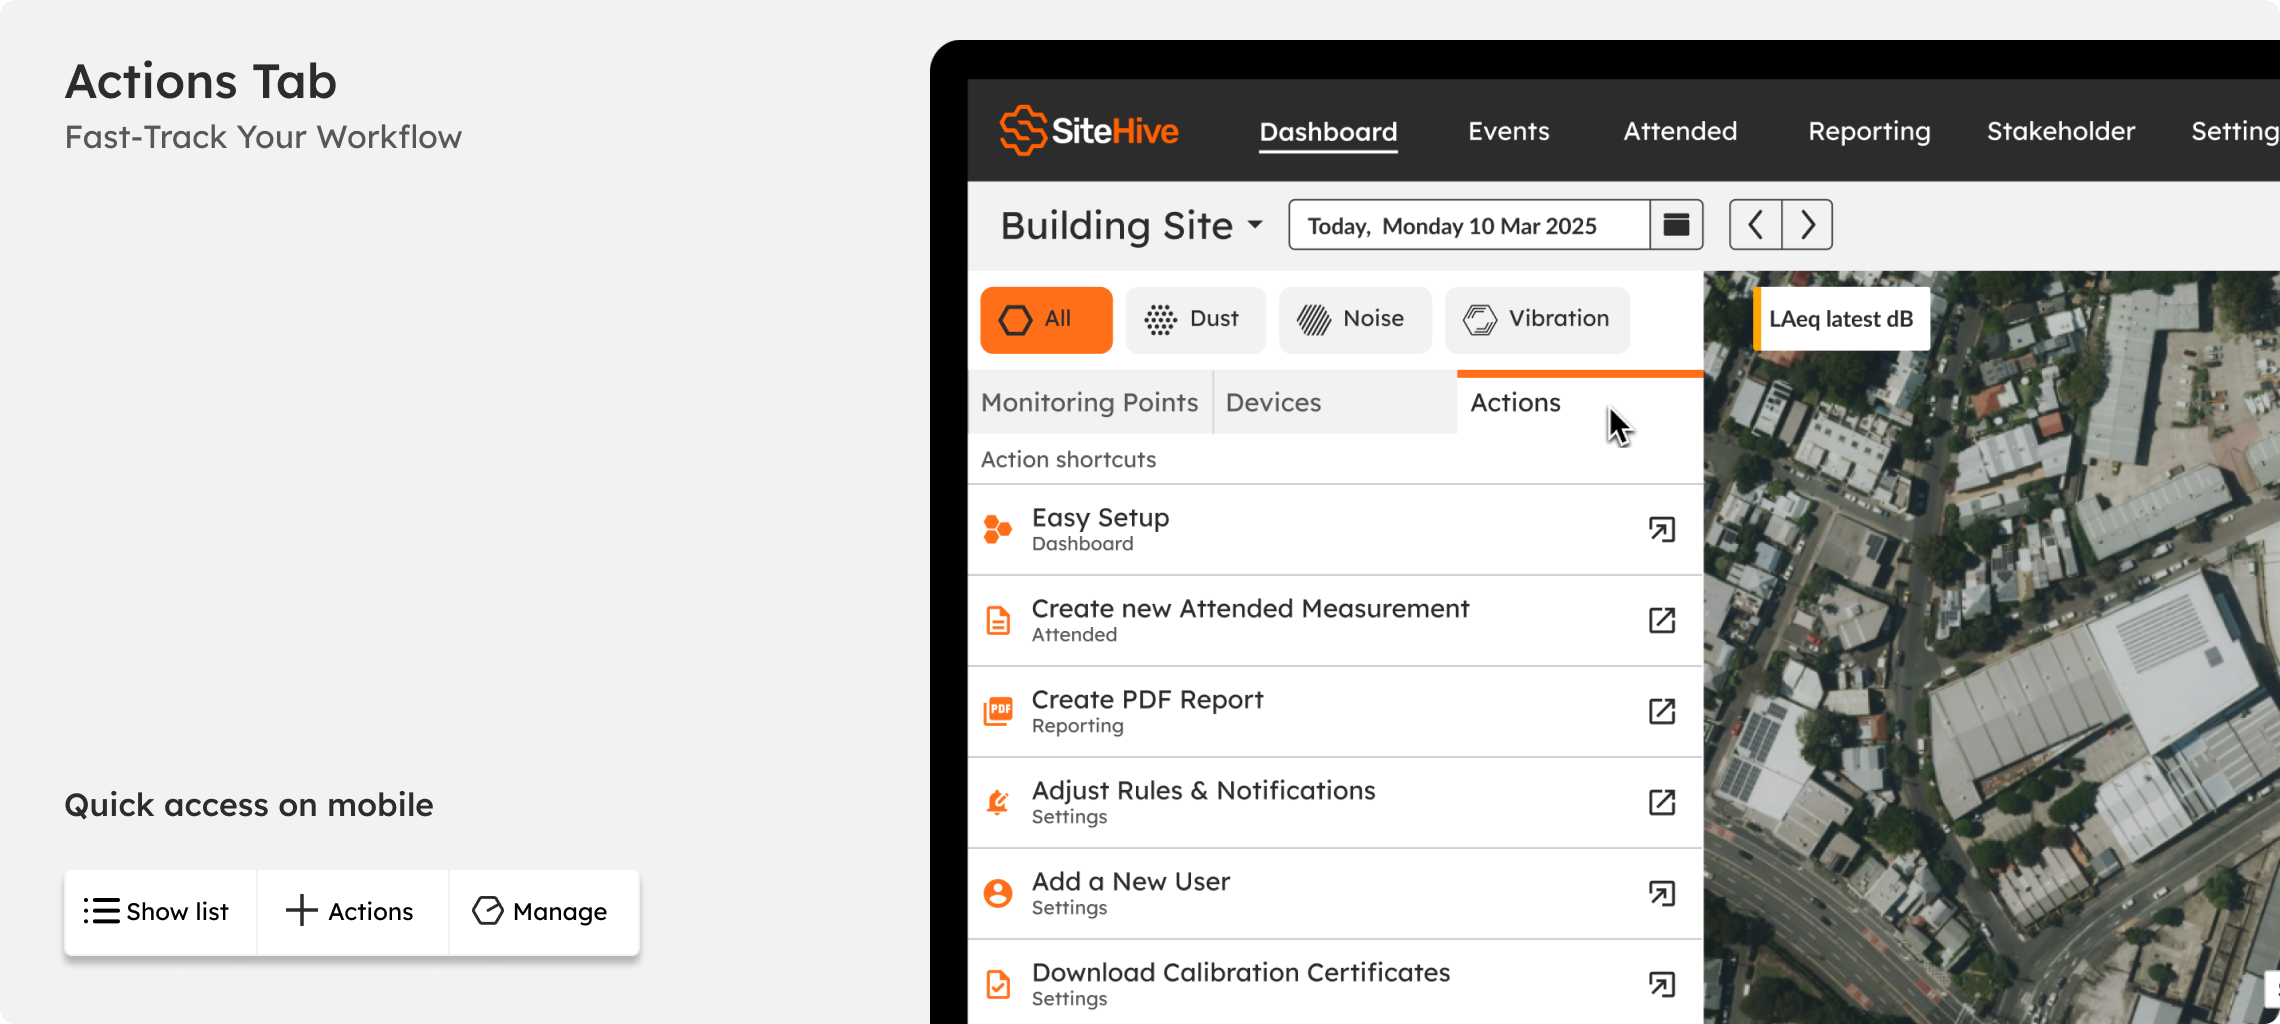
Easy Setup: configure devices, Monitoring Points, rules, and notifications in a matter of clicks.
Create new Attended Measurement: for SiteHive Enviro Pro users, record a new measurement.
Create PDF Reports: generate polished, professional reports in seconds.
Adjust Rules & Notifications: tailor alerts to suit your project needs.
Add new Users: bring team members on board so everyone's on the same page.
Download Calibration Certificates: get all certificates for all devices in a single download.
When using the Dashboard on mobile, these actions are available via the 'Actions' button in the bottom button bar, or in 'Show list', then select the 'Actions' tab.
Manage Monitoring Points & Devices
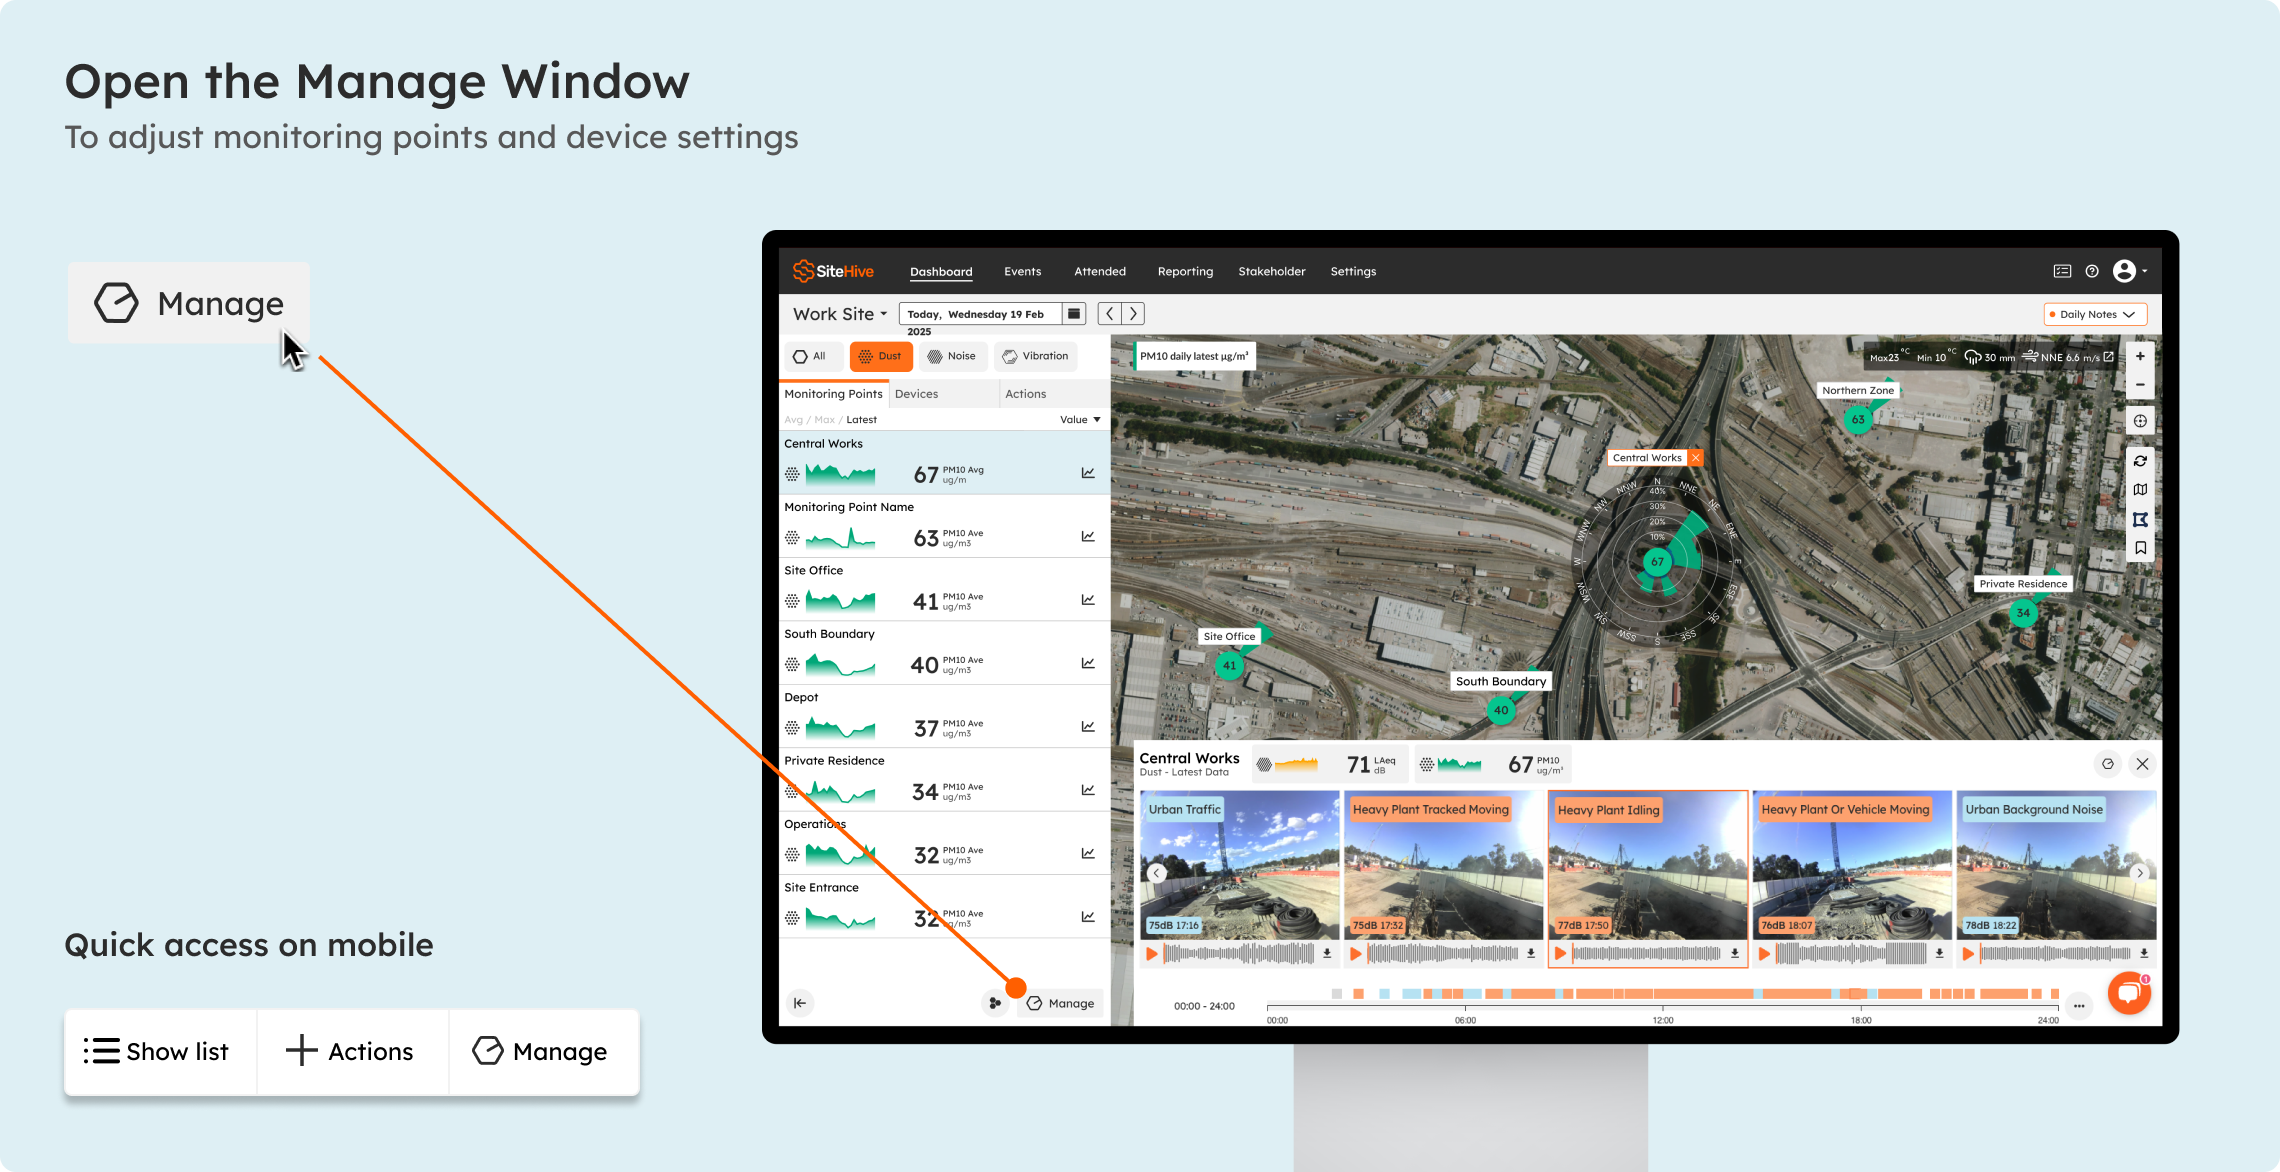
Whether you are managing the settings of a Monitoring Point, or looking for the power or signal strength of a Device, they are managed in a single window. Select a Monitoring Point or a device, hit the Manage button, and a window opens showing the information you need, with a Monitoring Point view and a Device view. Click Manage to adjust settings and devices.
Media Timeline
Want to see what's happening on site in real time? The Media Timeline brings integrated audio and video together so you can understand the story behind the data:
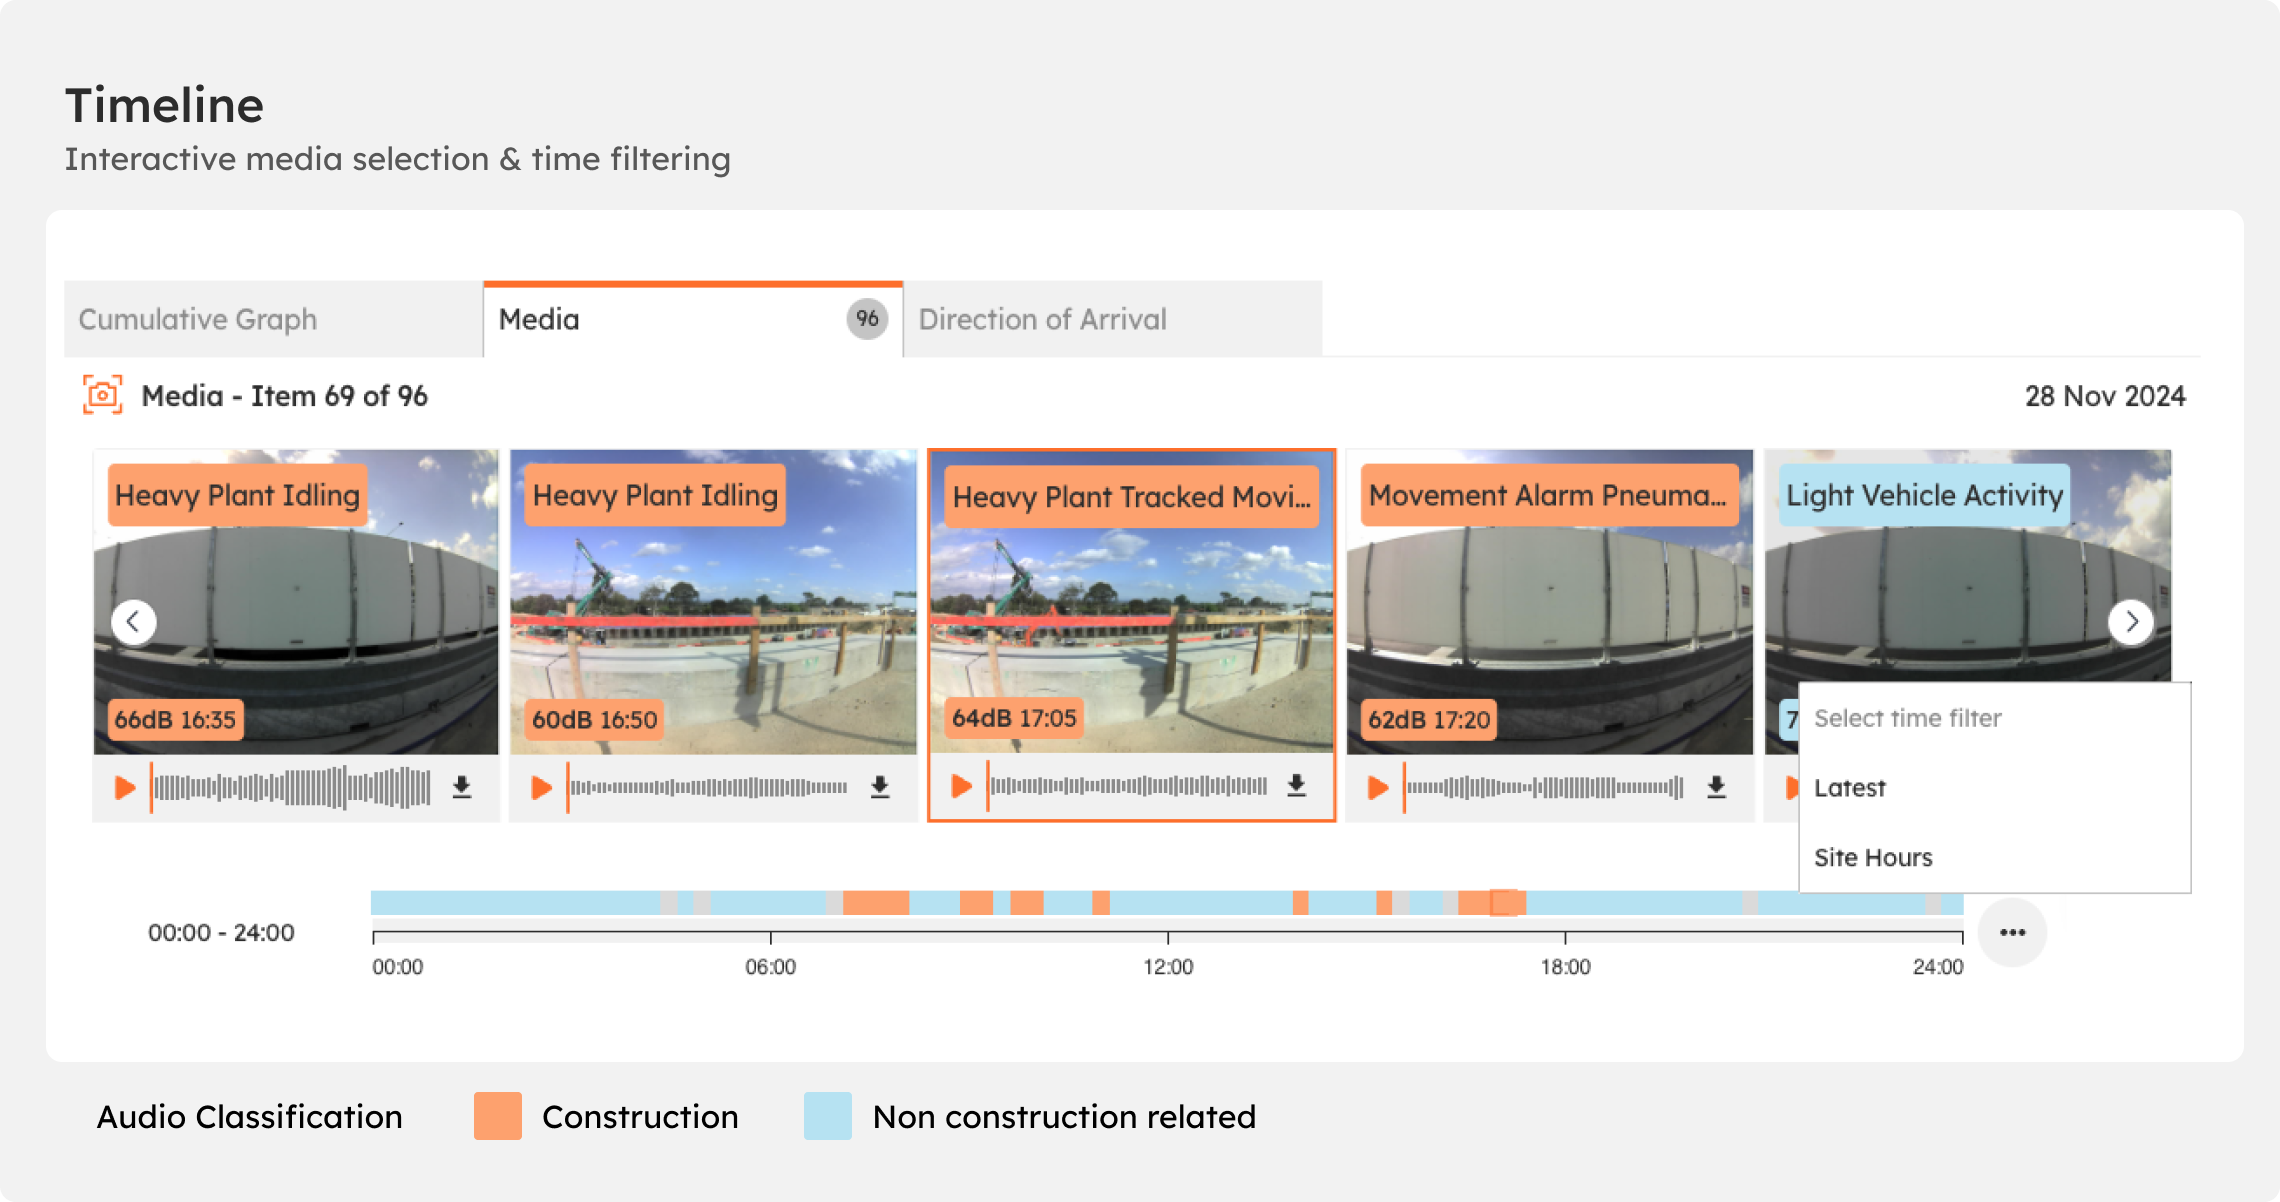
Audio Classifier (SiteHive Enviro Pro feature): automatically identifies and classifies noise. Orange (🟠): site-related noise (reportable). Blue (🔵): external noise (non-reportable).
Time Brushing: focus in on specific timeframes to really dive deep into the details.
Filter by Site Hours: easily focus on key work hours or catch the latest updates in a flash.
Quick Navigation: access recordings and visuals in just one click, no need to go hunting for the right files.
Daily Notes
Record observations, attach photos and files, and tag Monitoring Points directly from the Dashboard using Daily Notes (top right corner). Notes can be included in your PDF reports: see Daily notes.
What’s next
Reporting overview (long-term trends, stats and downloadable reports)
Add a device with Easy Setup (add a new device to the Dashboard)
Managing multiple sites? The Portfolio page: every site at a glance (all your sites in one place)