
Stats and analysis
Stats and Analysis provides a clear overview of your monitoring data, highlighting key trends, exceedances, and summaries. Stats and Analysis components can also be part of your PDF reports.
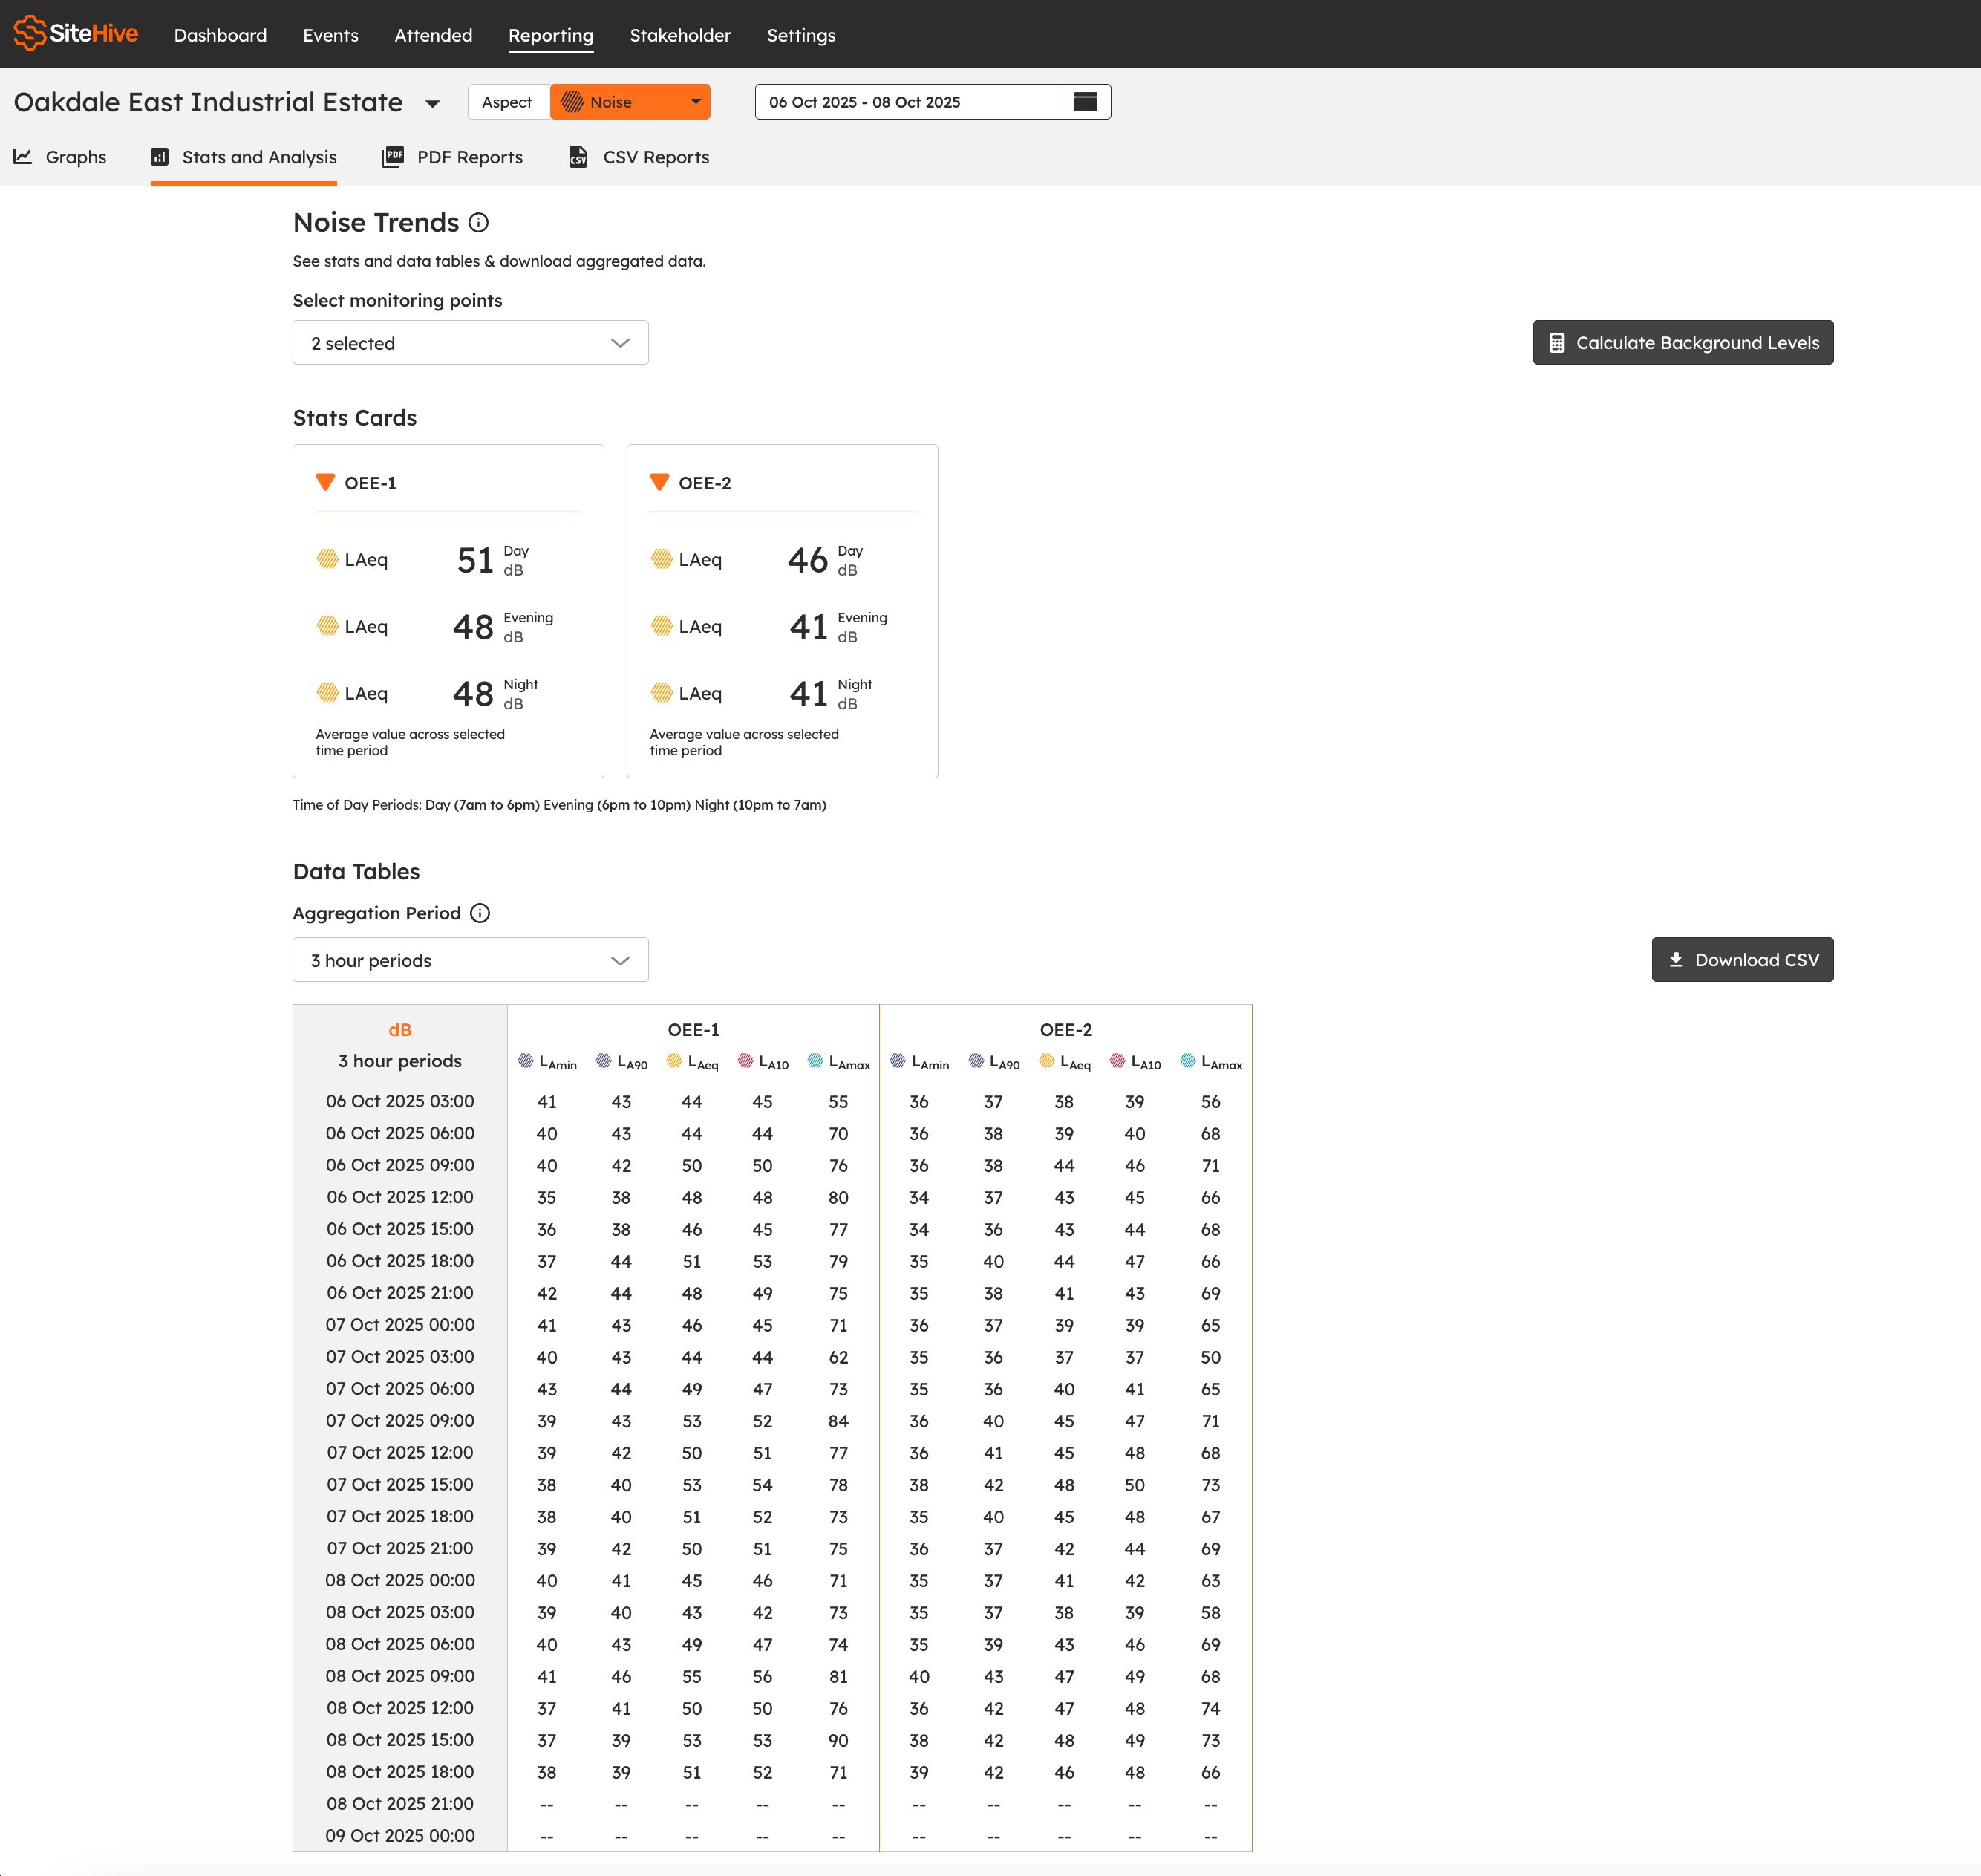
Data Tables
Each section pairs its stats with Data Tables: the same data in tabular form, aggregated by a time period you choose. In any Data Tables section:
Aggregation period: select from the drop-down how you'd like to view your data (1-minute, 15-minute, hourly, 3-hour or daily periods).
Download CSV: click the Download CSV button to export the table for analysis in your preferred tool.
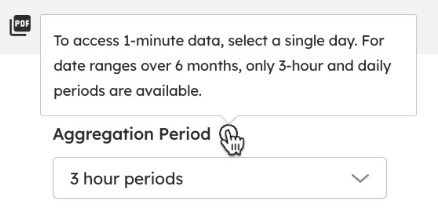
⚠️ Some aggregation periods are limited by date range: 1-minute data is available when viewing a single day, and for date ranges over 6 months only 3-hour and daily periods are available.
ℹ️ Looking for event data instead? CSV Reports export event-based data; Data Tables export aggregated telemetry values.
Noise Trends
The Noise Trends section provides insights into noise levels across different Monitoring Points and time periods.
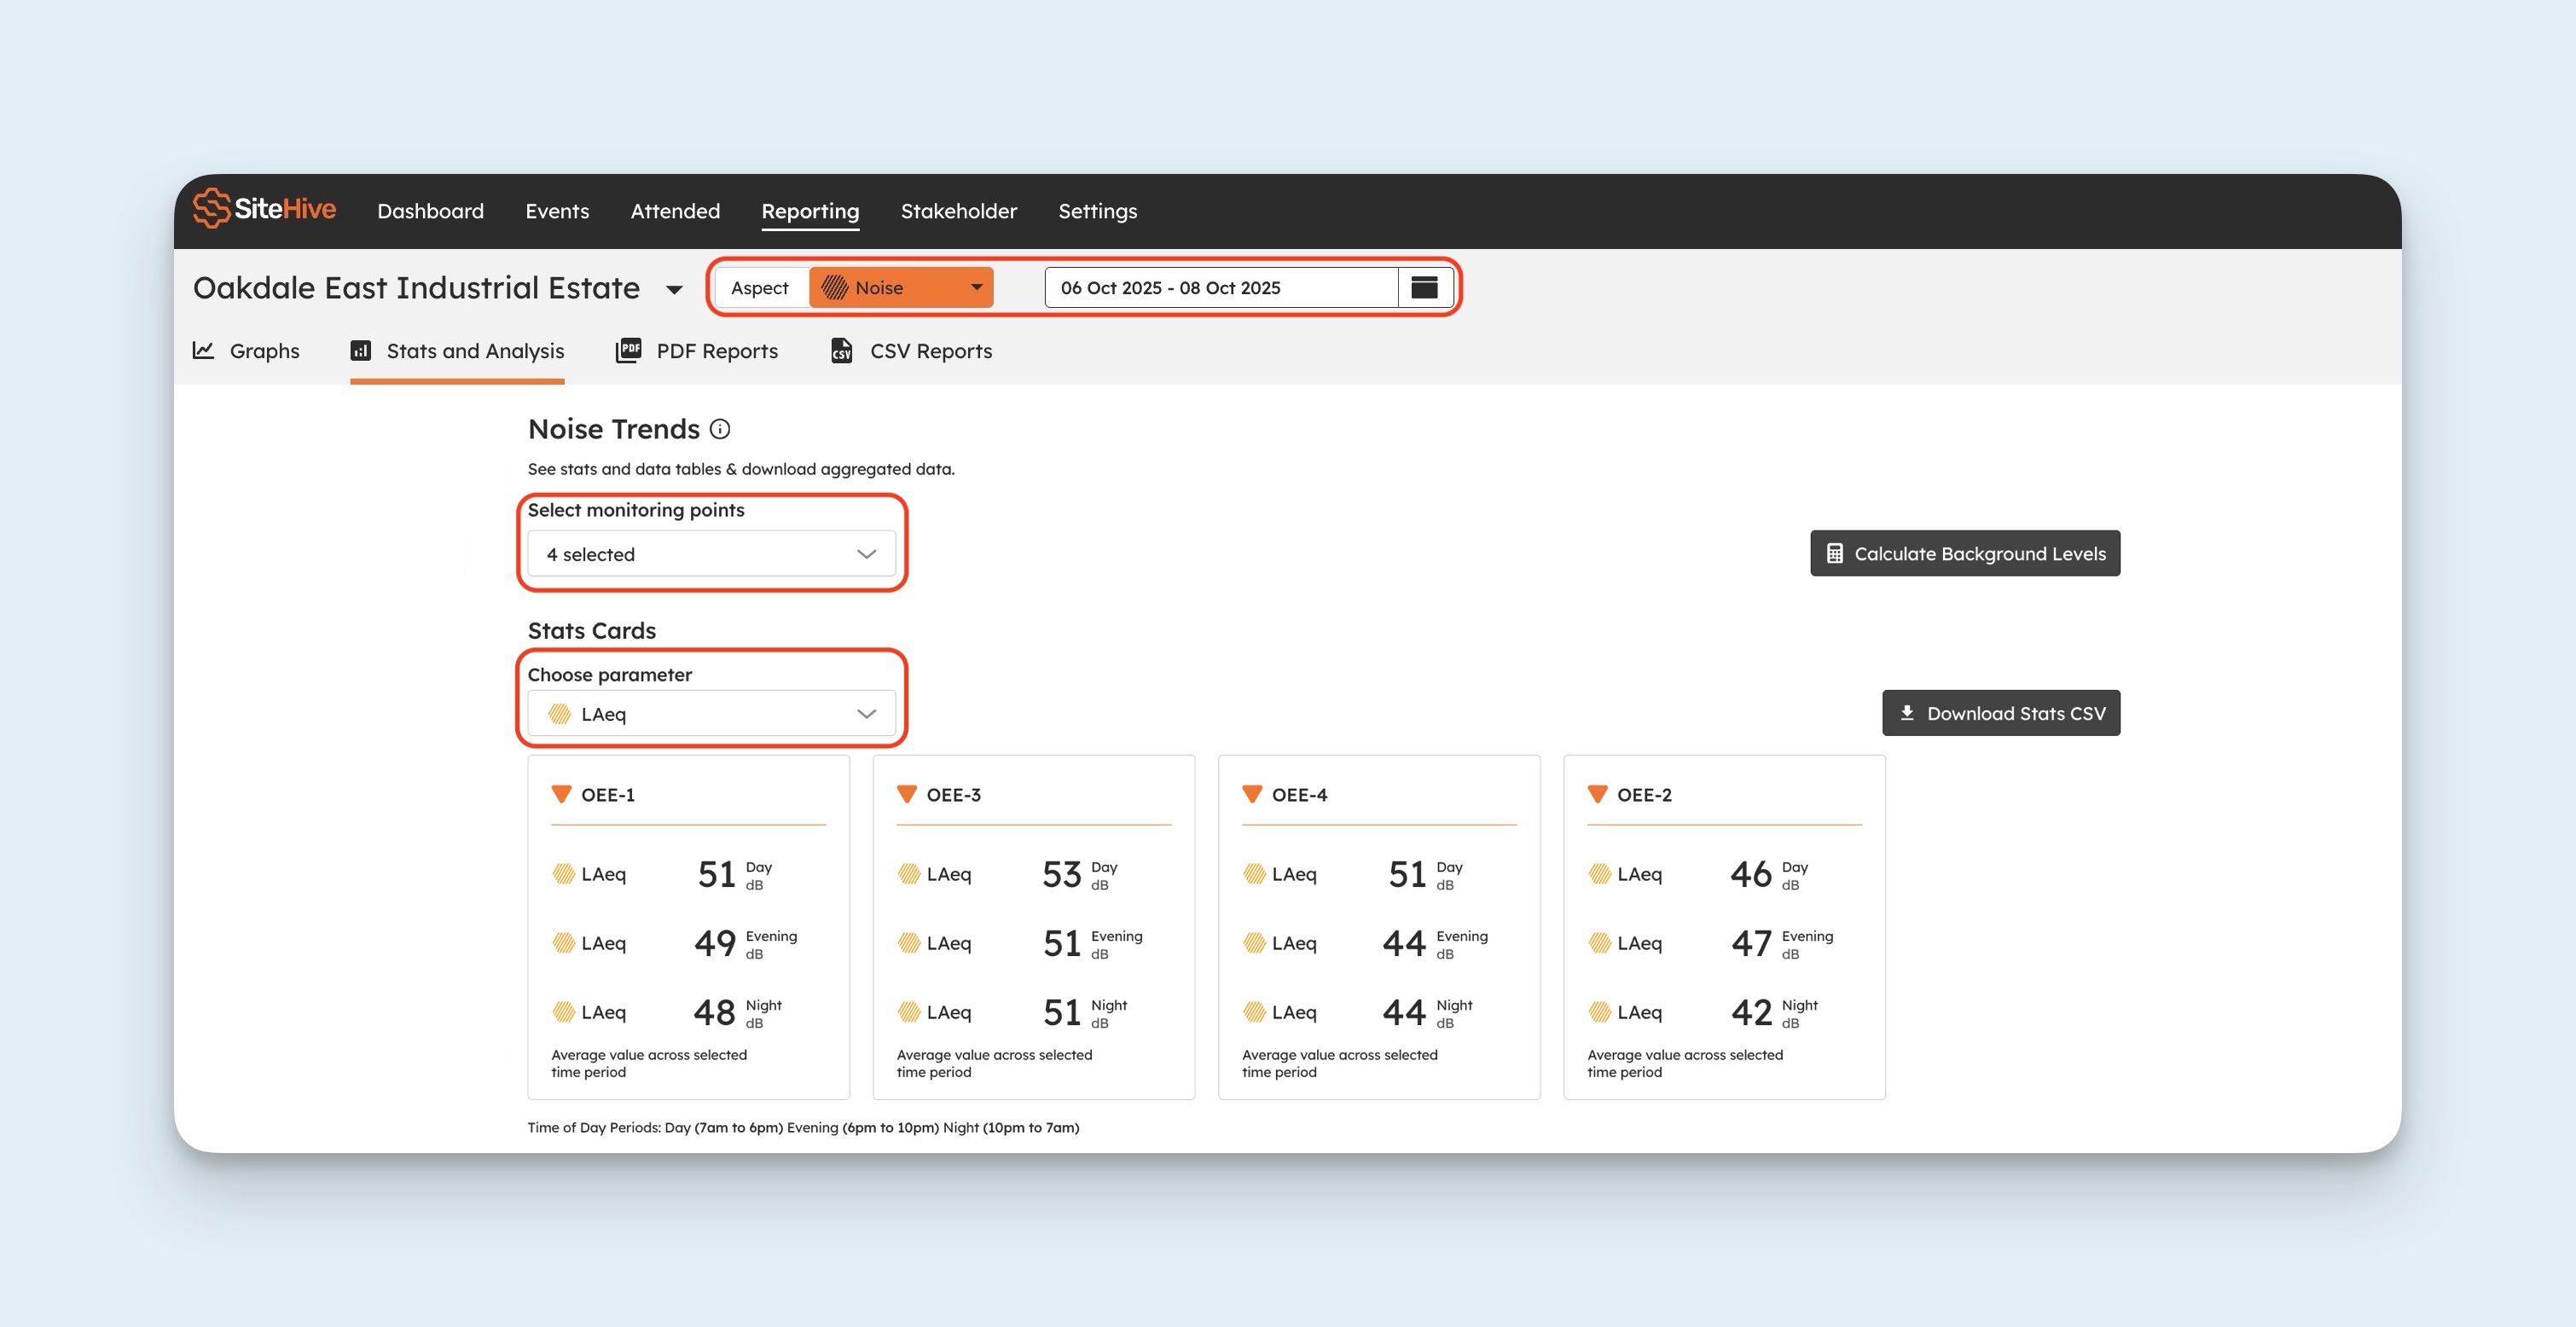
Monitoring Point Tiles
Select the Monitoring Points you would like to view noise trends for.
Then choose a parameter from the drop-down. The noise trends will be shown for three time periods:
Day (7 AM - 6 PM)
Evening (6 PM - 10 PM)
Night (10 PM - 7 AM)
These values represent the noise levels during the selected time range. The Day, Evening and Night bands are fixed standard assessment periods (they don't follow your site's configured hours).
Data Tables
Choose an aggregation period and click Download CSV to export the table. Below the LAeq summary, you will find additional noise metrics:
LA90 – Background noise level (level exceeded 90% of the time)
LAmax – Maximum recorded noise level
LAmin – Minimum recorded noise level
LA10 – Noise level exceeded 10% of the time
These metrics are broken down into your selected aggregation periods.
⚠️ On SiteHive Enviro (non-Pro), data is aggregated in 24-hour periods only. Finer aggregation periods are part of SiteHive Enviro Pro.
Dust Trends
The Dust Trends section provides an overview of particulate matter (PM) levels.
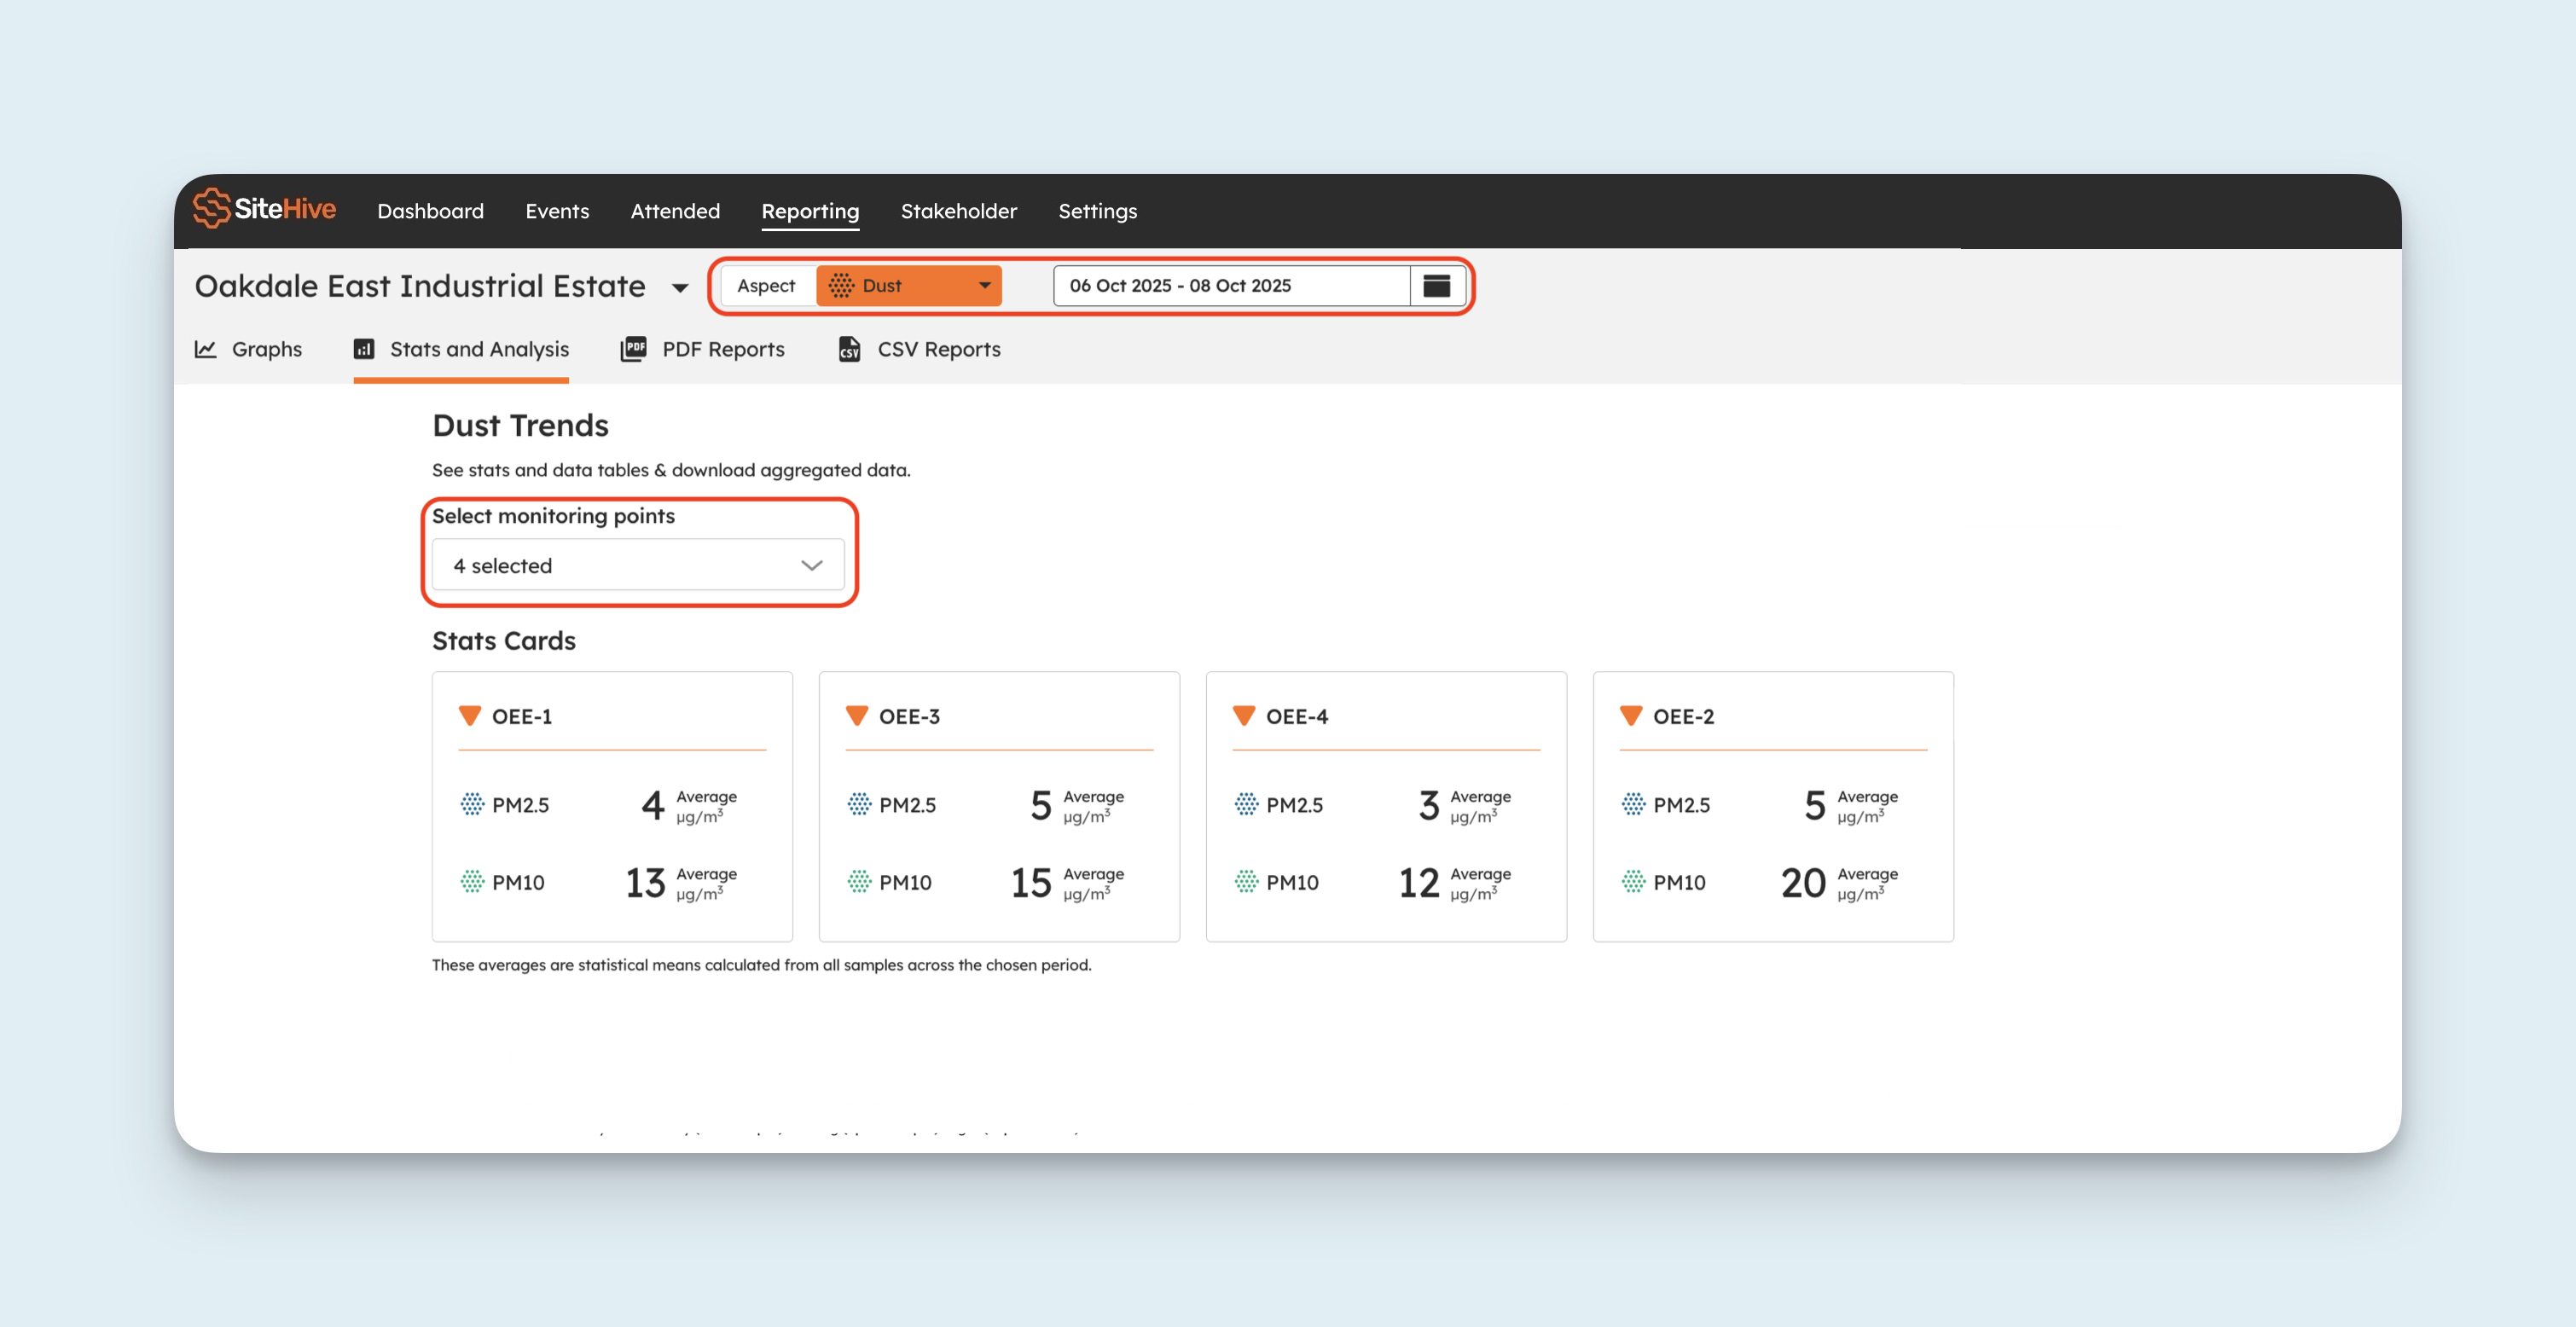
Monitoring Point Tiles
Select the Monitoring Points you would like to view dust trends for.
Each Monitoring Point displays daily average concentrations of PM2.5 and PM10.
These values are calculated as statistical means from all samples collected within the selected time range.
Data Tables
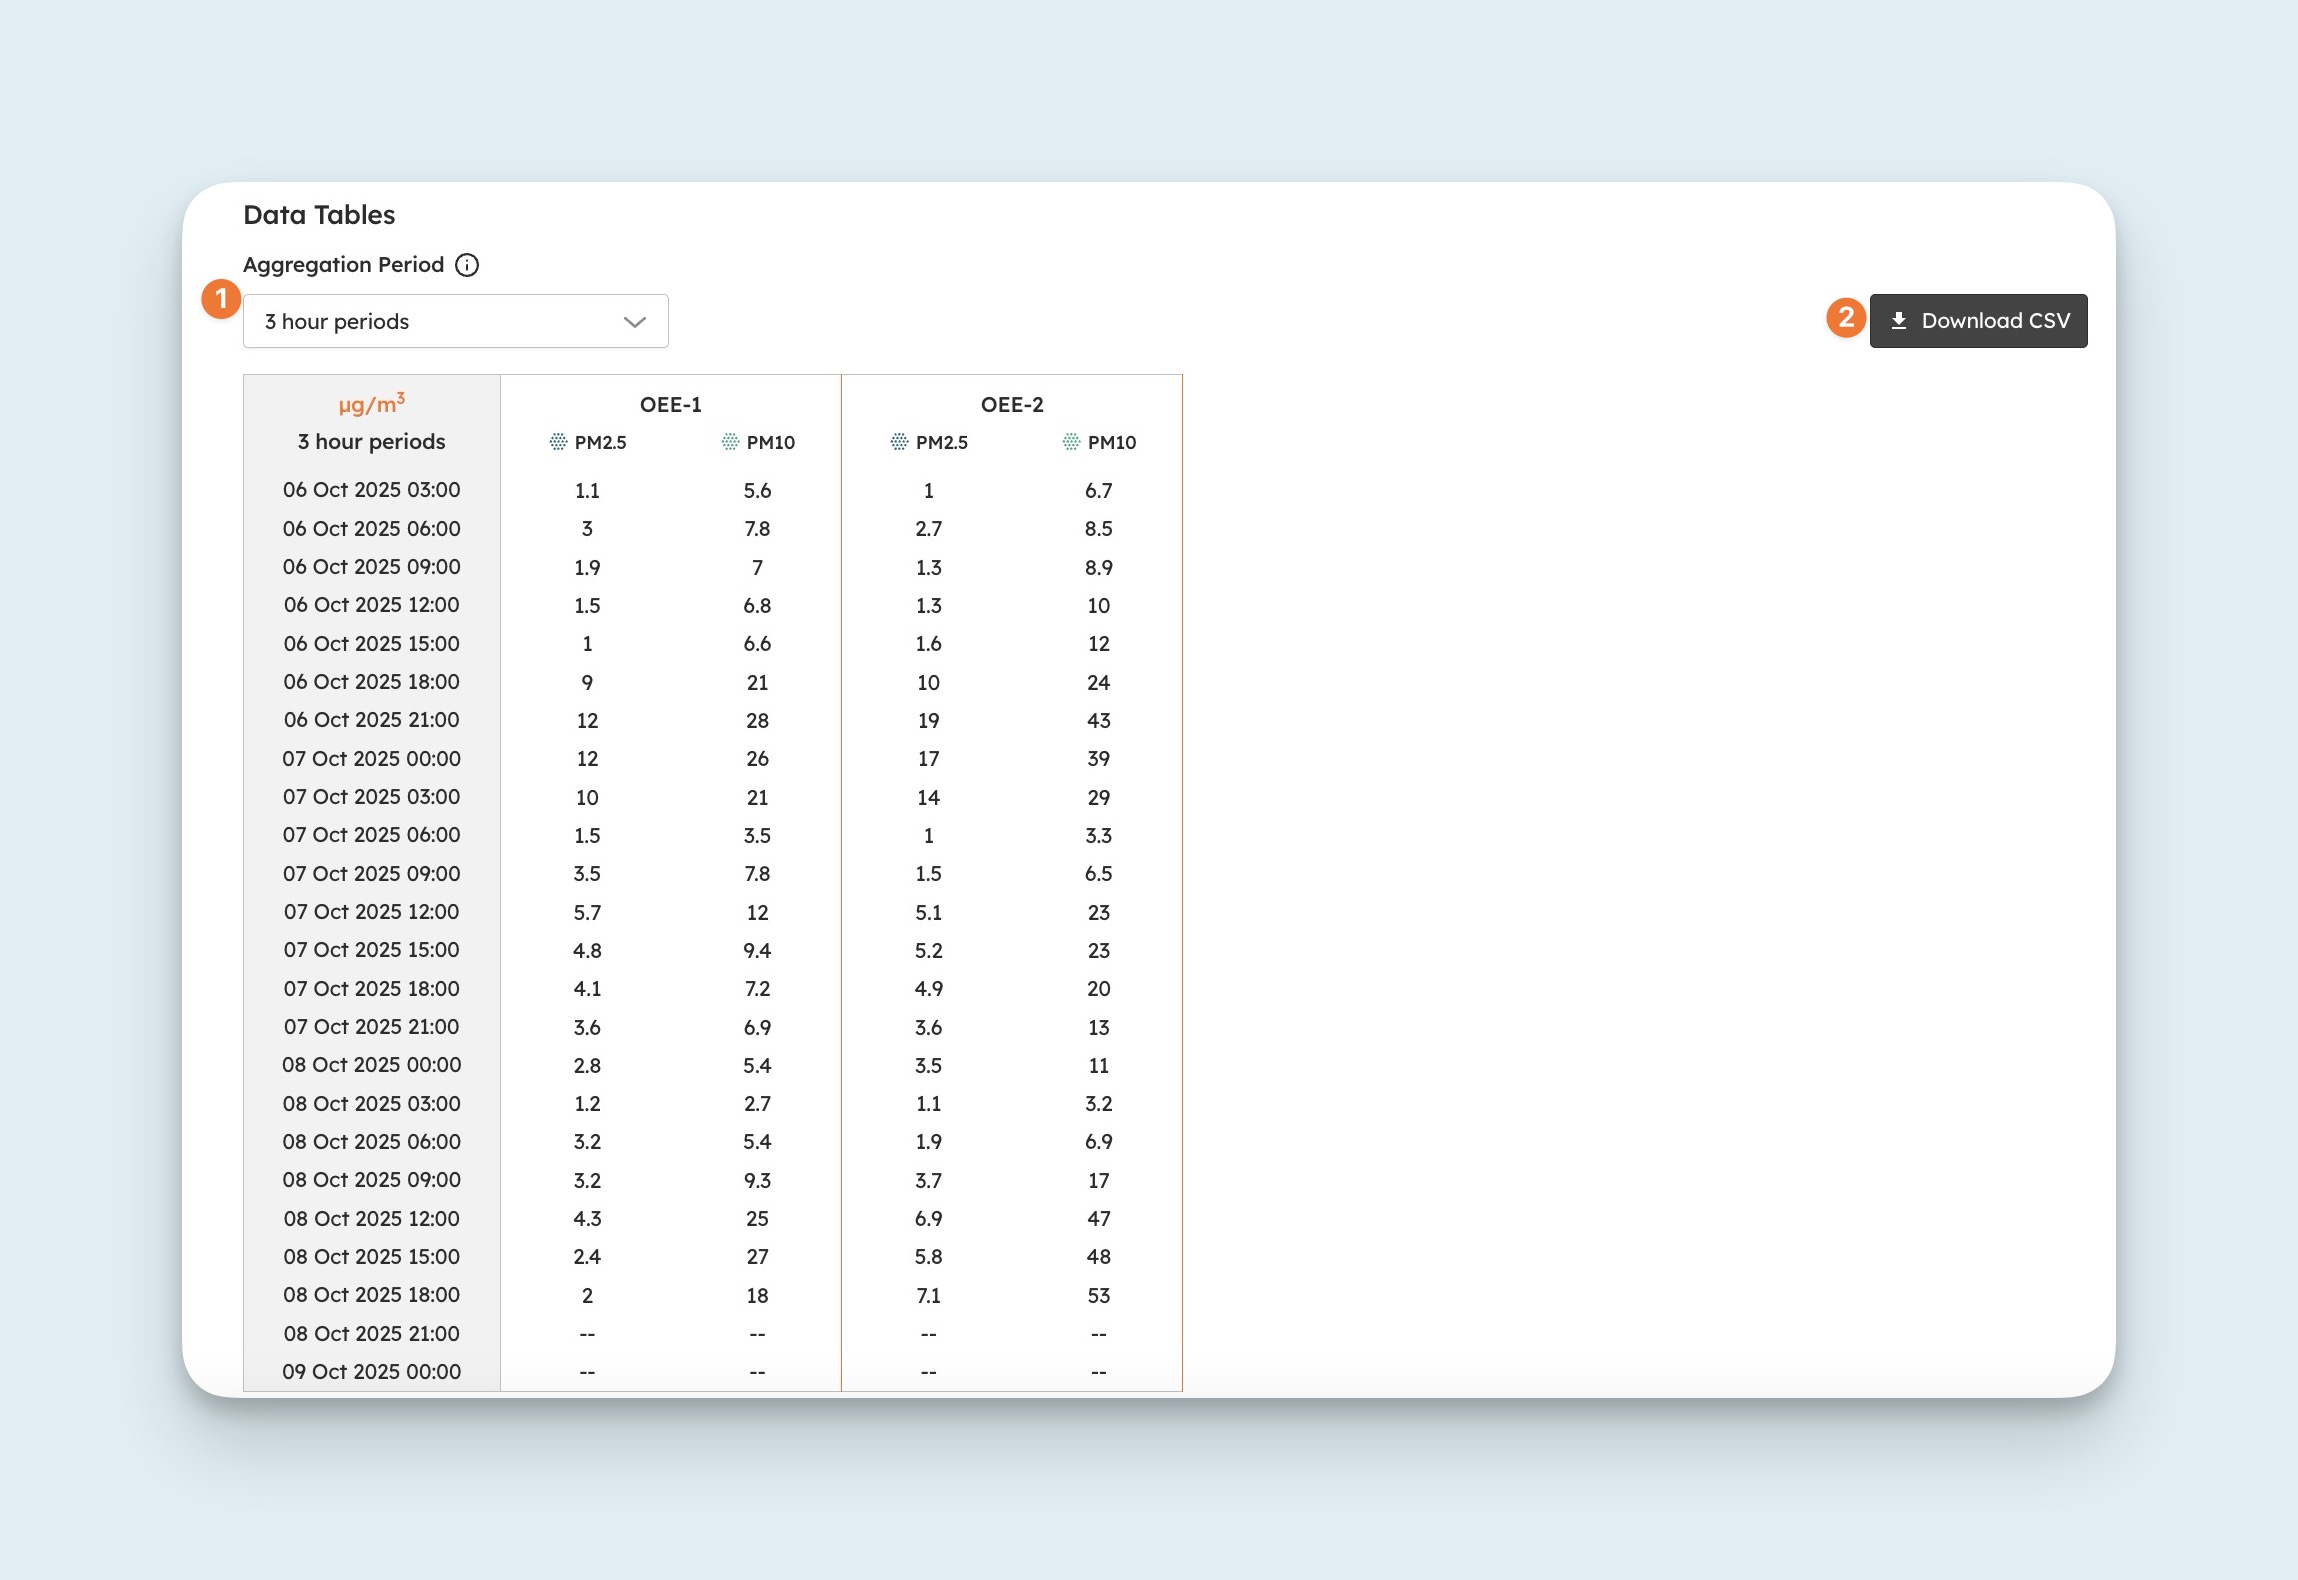
Choose an aggregation period and click Download CSV. Below the Monitoring Point tiles, a detailed table breaks down PM2.5 and PM10 daily averages for each day within the chosen date range.
Vibration Trends
The Vibration Trends section tracks structural and human comfort vibration levels. Use the PPV and VDV tabs to switch between the two.
Peak Particle Velocity (PPV): Structural Impact
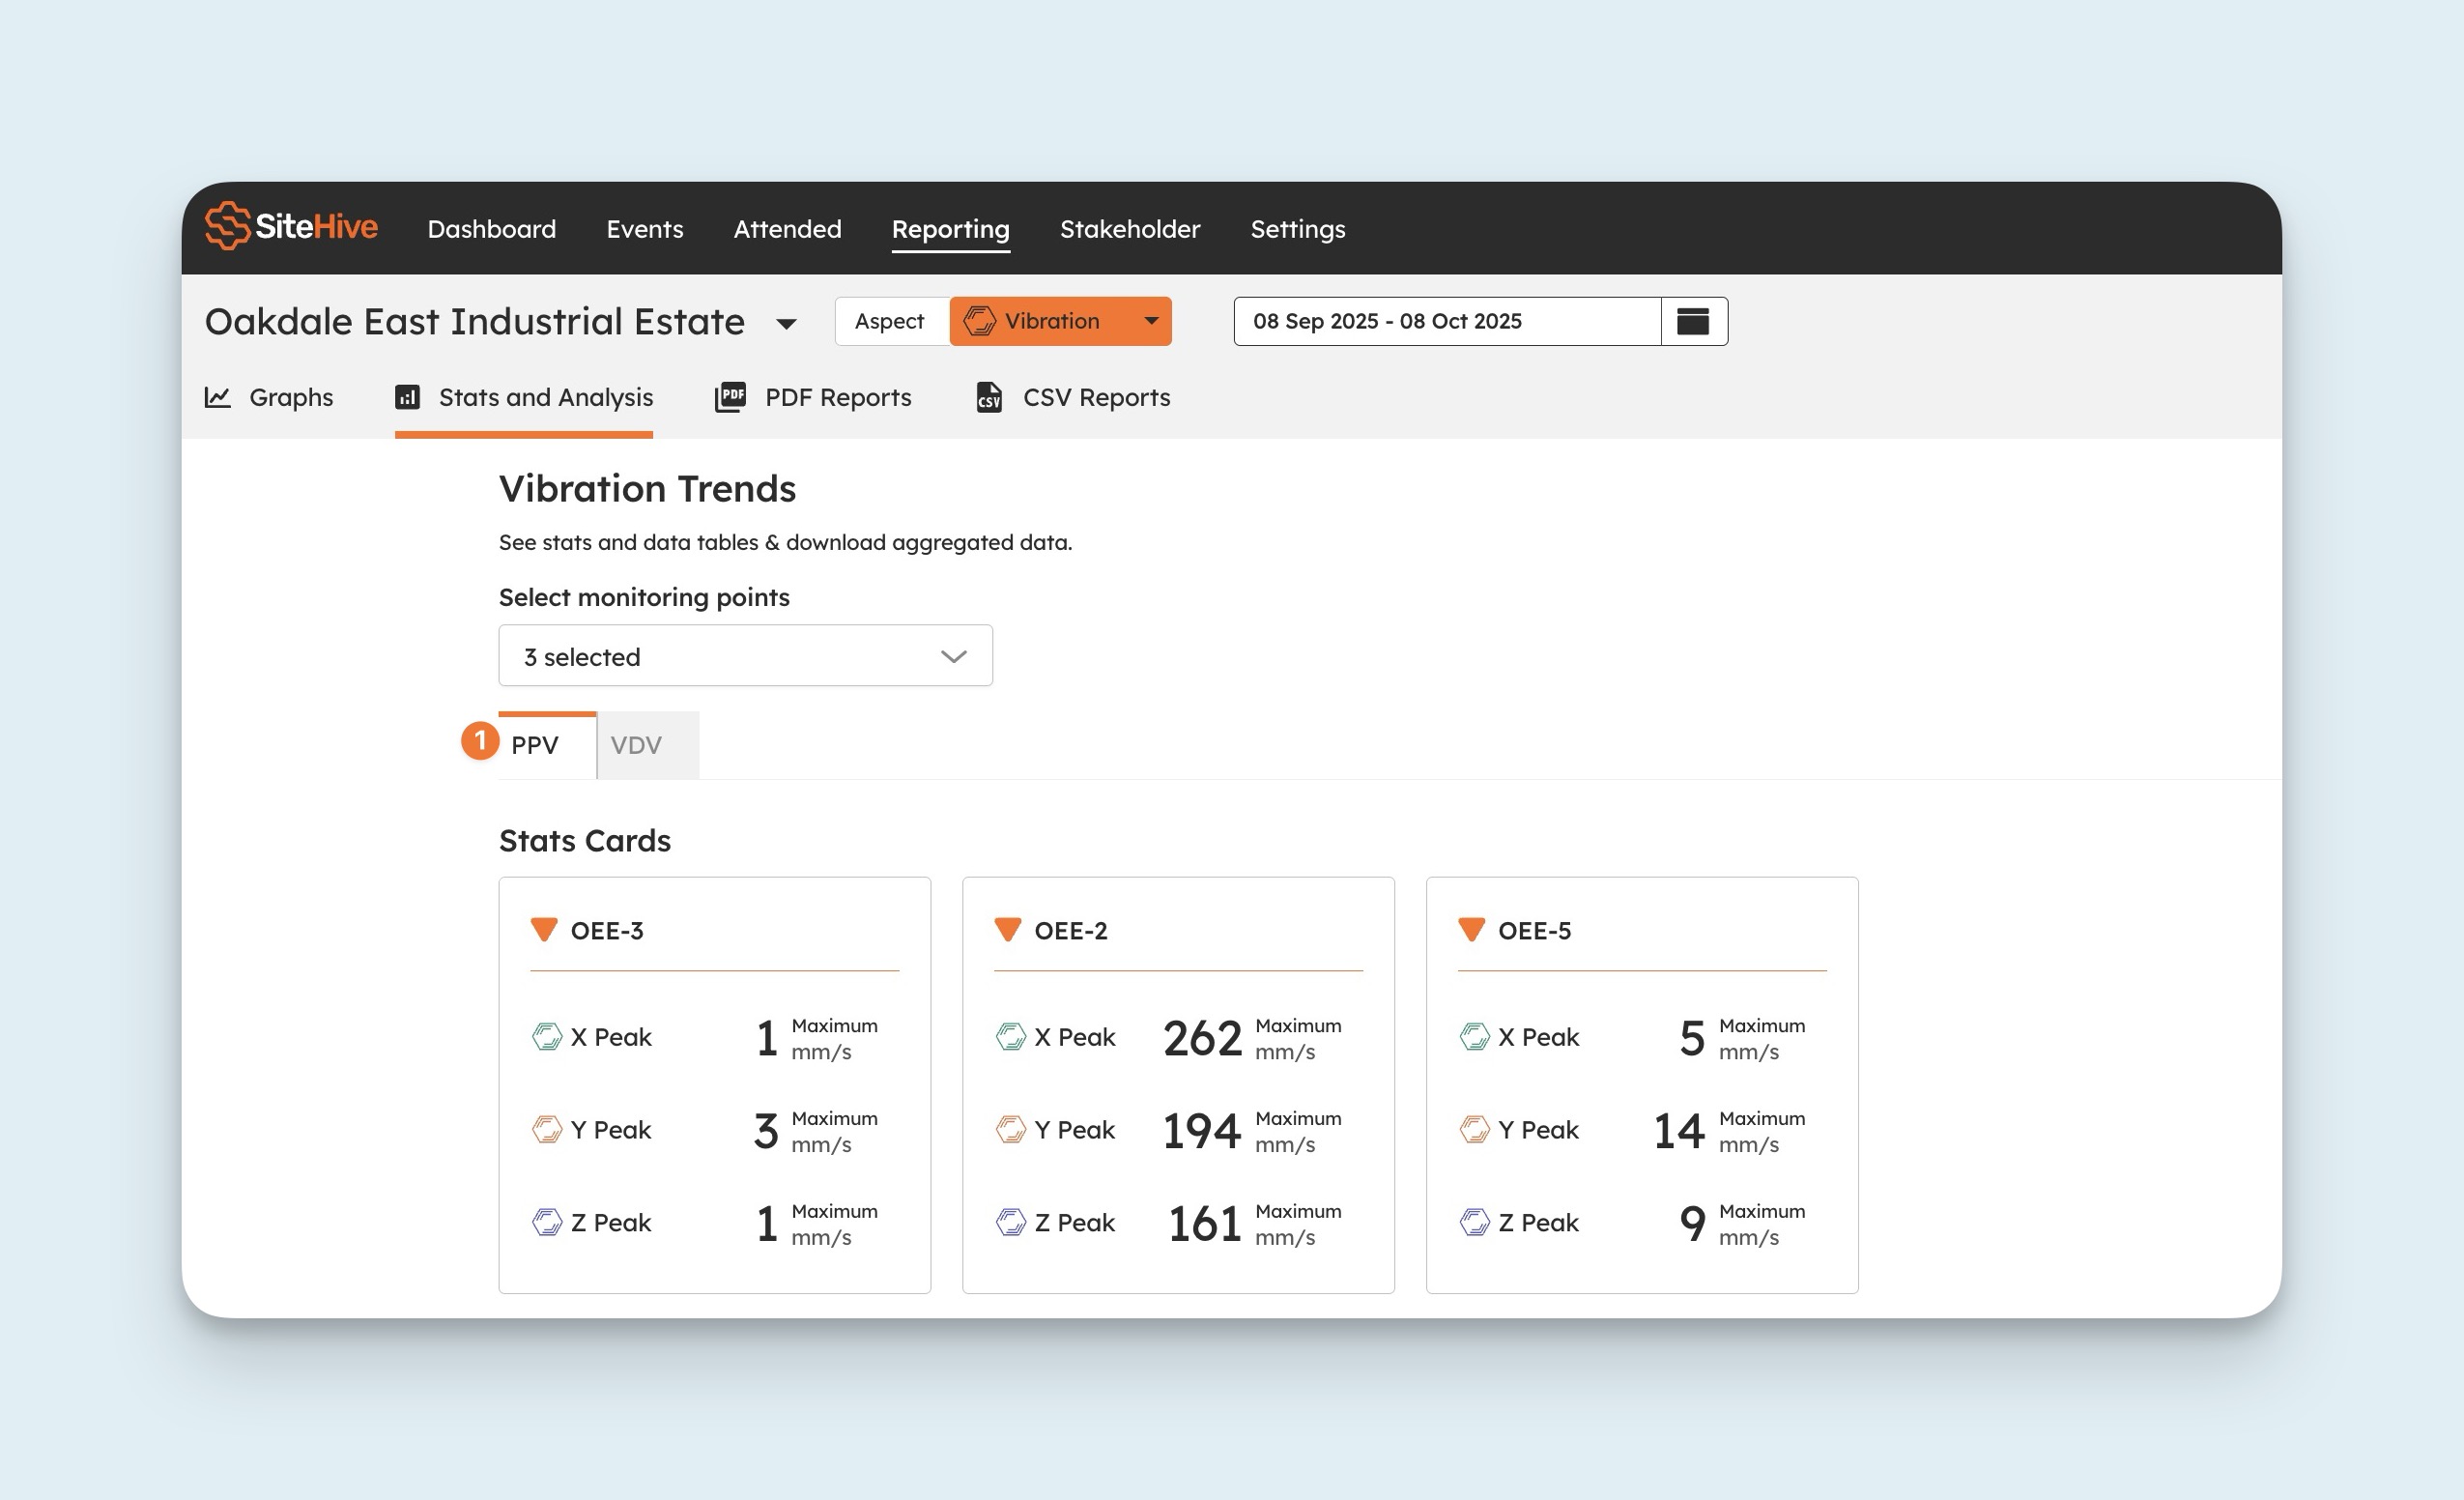
Displays the maximum PPV (Peak Particle Velocity) for:
X-axis
Y-axis
Z-axis
The table below provides daily maximum PPV values for the selected date range.
Vibration Dose Value (VDV): Human Comfort
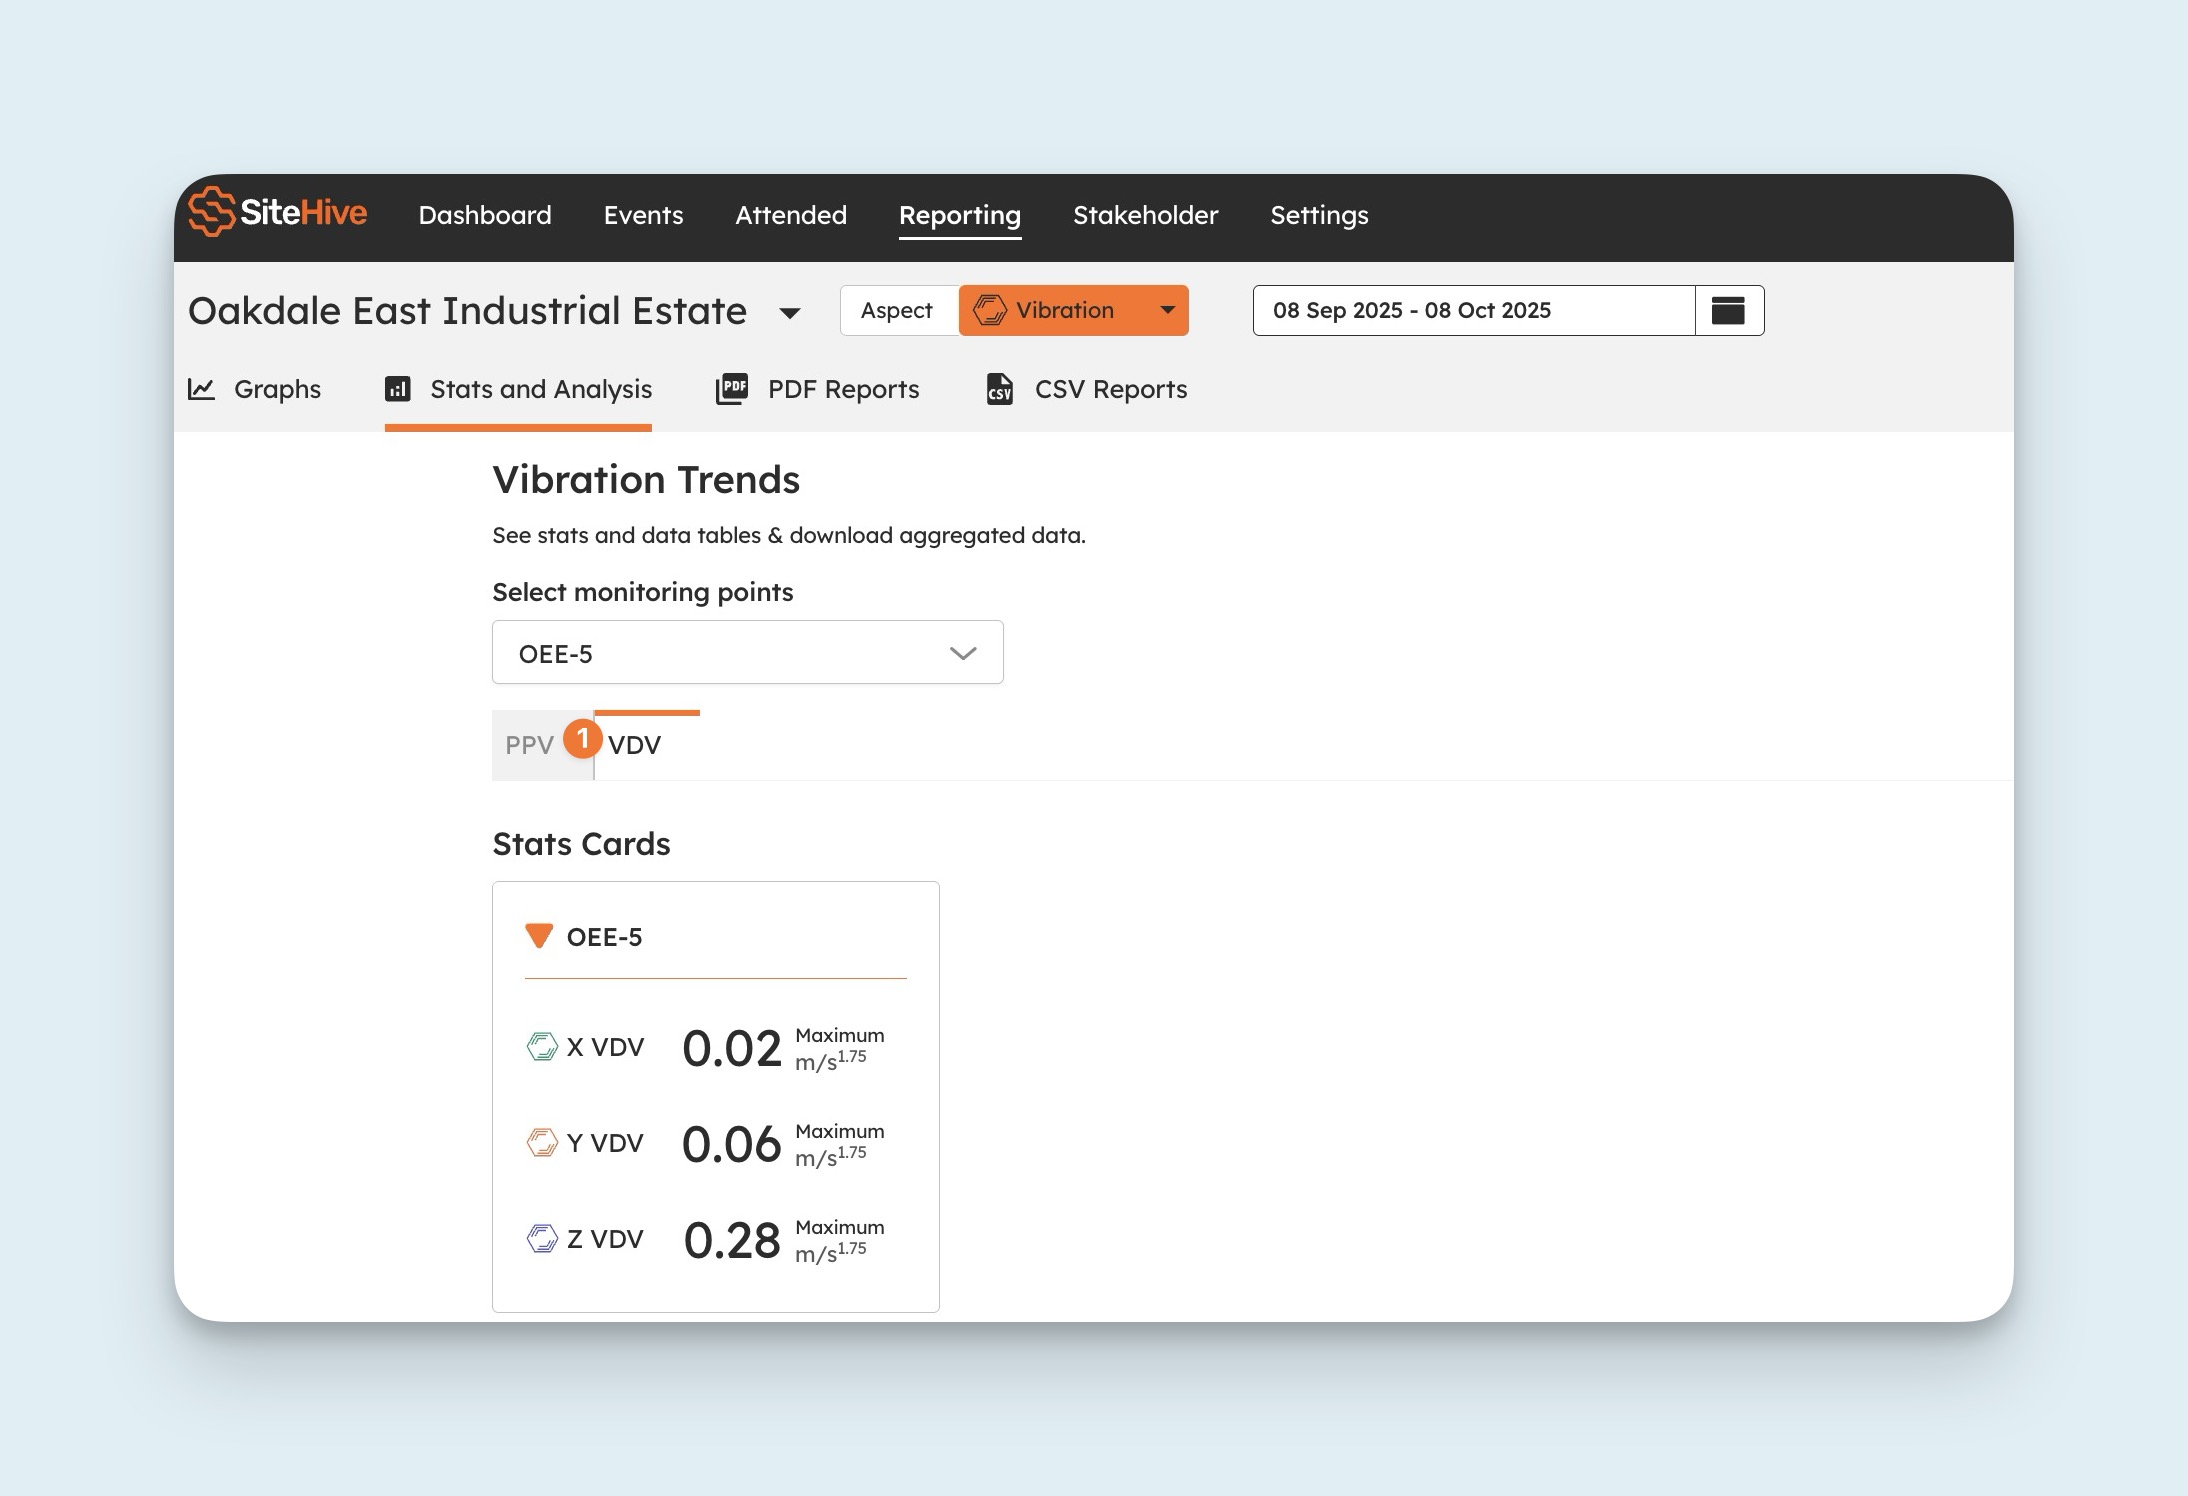
Displays the maximum VDV values for:
X-axis
Y-axis
Z-axis
Data Tables
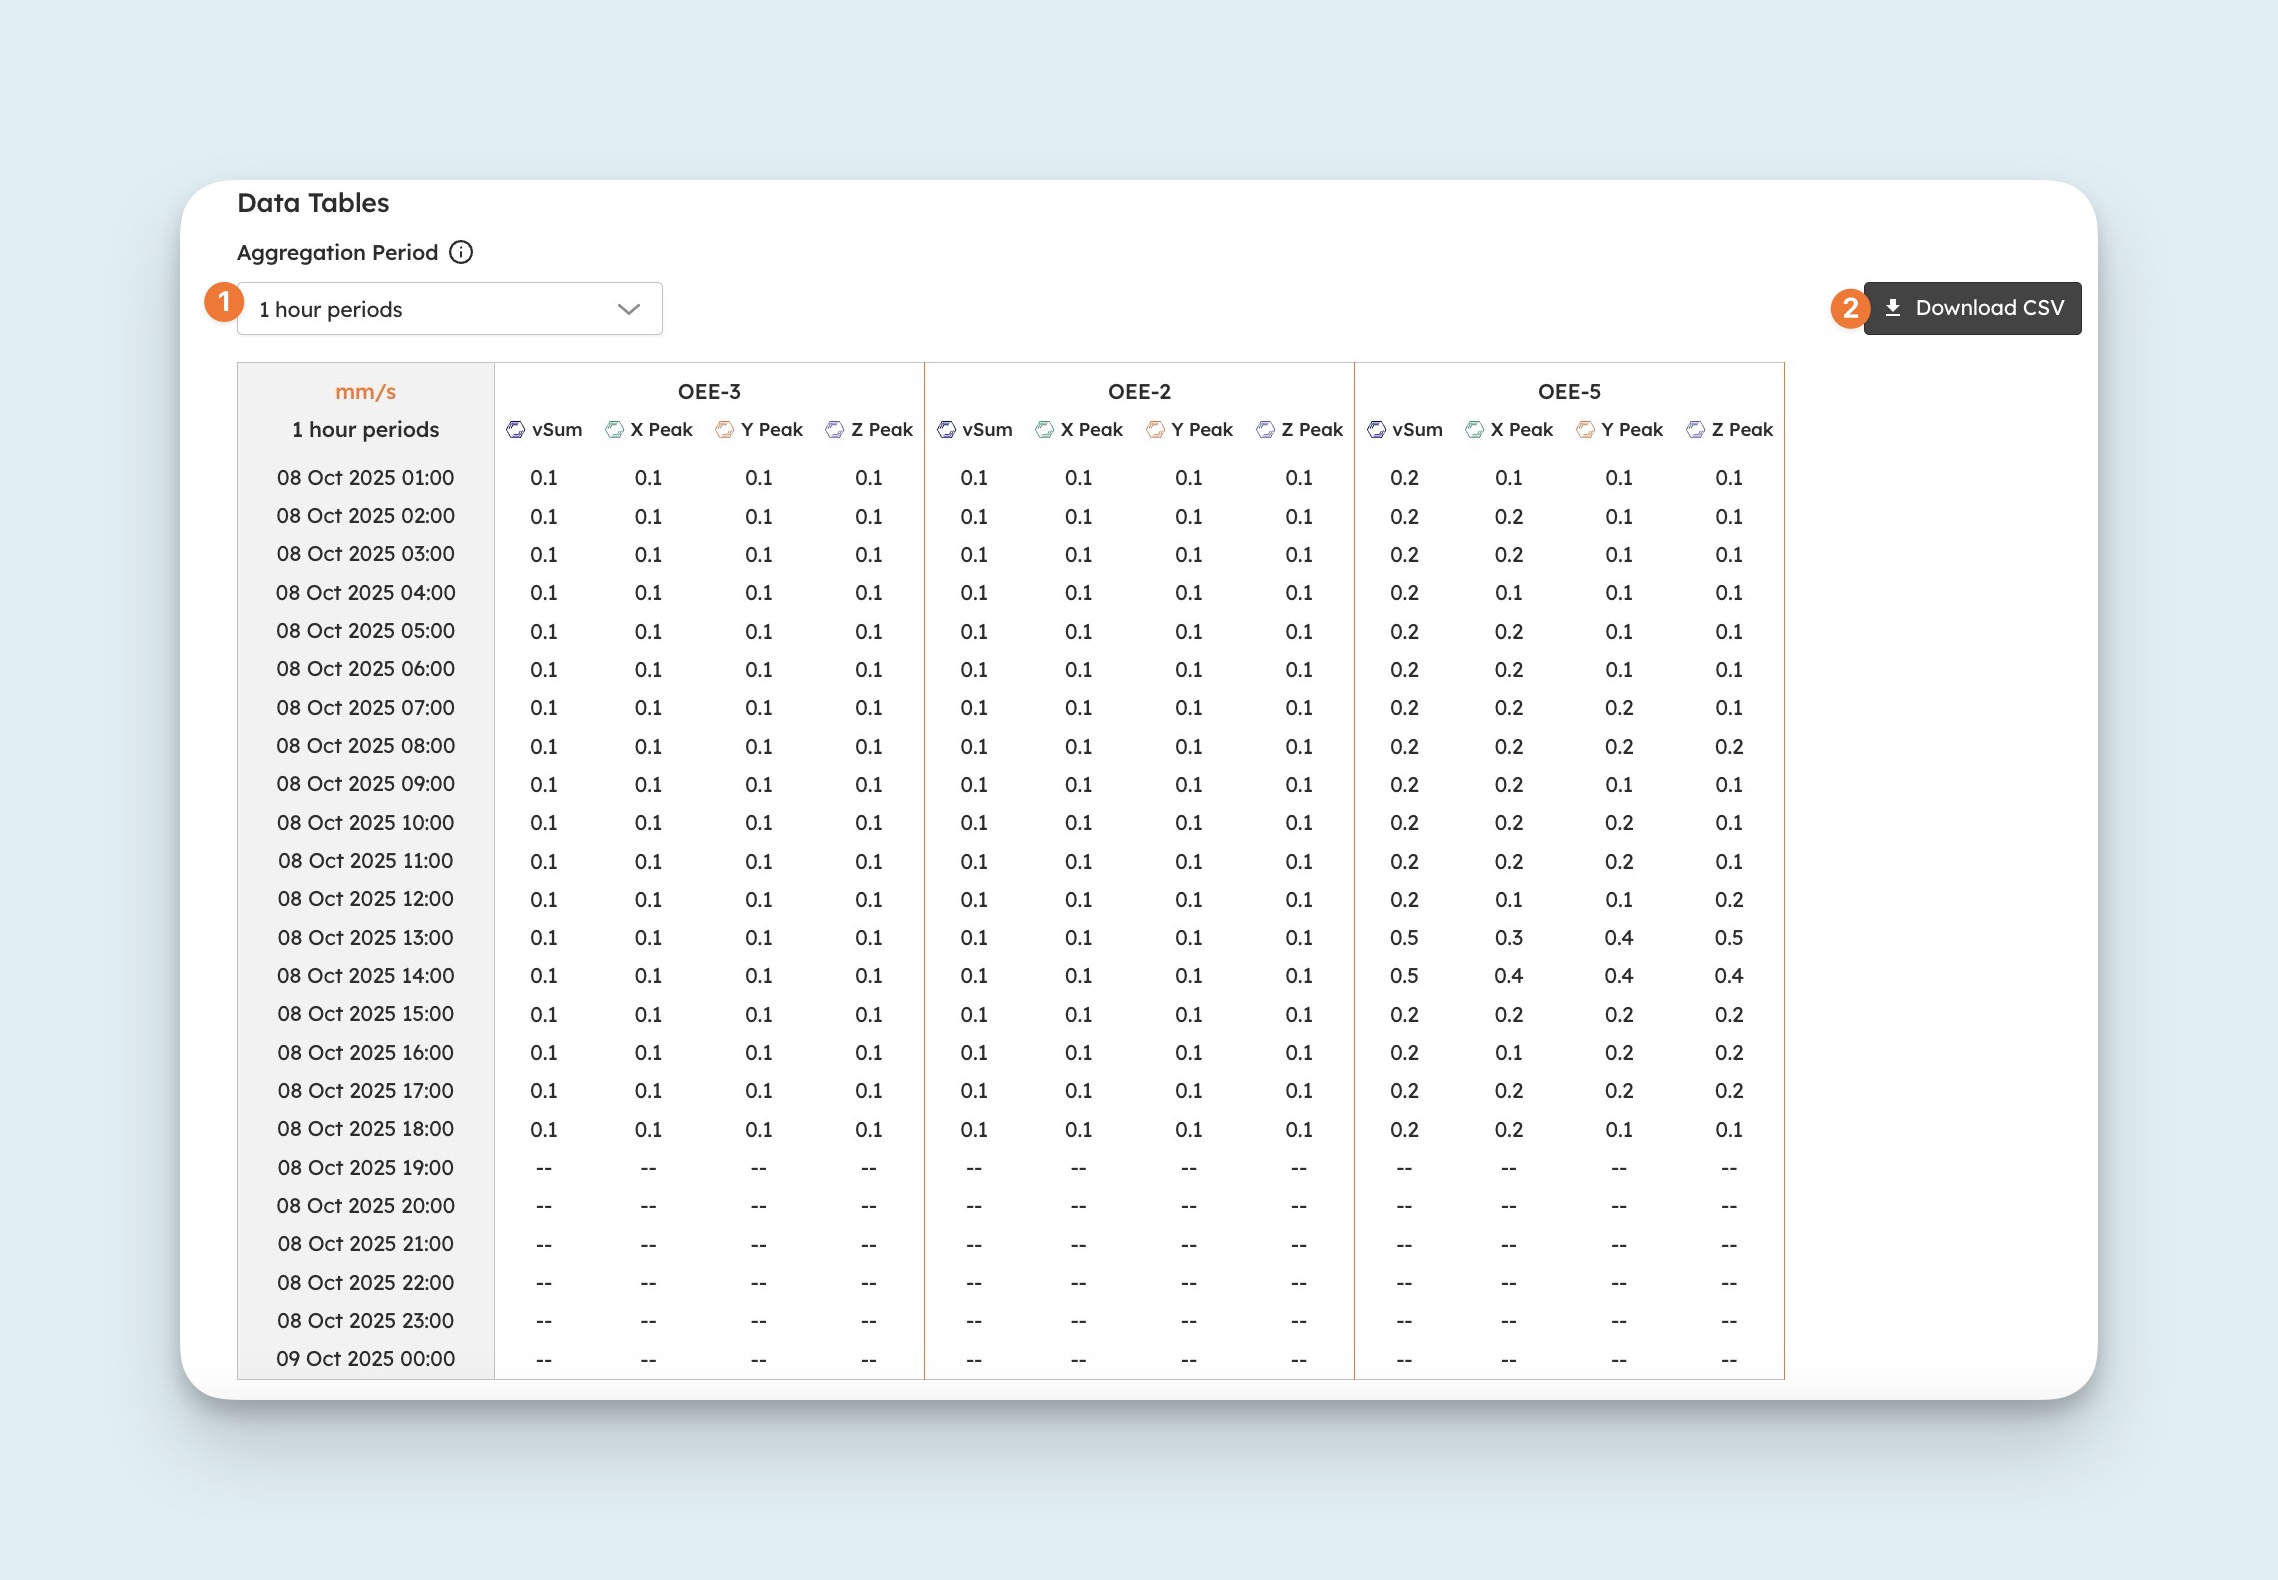
Choose an aggregation period and click Download CSV. If you picked PPV, the table shows vSum and the X, Y and Z peaks for the selected date range; if you picked VDV, it shows the X, Y and Z values.
What's next
Graph your data (explore and investigate on screen)
Create a PDF report (a comprehensive site report)
Export a CSV report (simple data in an easy-to-use format)