
Octave bands: assess noise frequency
Octave bands break your overall noise level down by frequency, so you can see which frequencies are contributing most. That tells you whether a noise is a low rumble, a mid-range drone or a high-pitched whine.
This matters when your approval or management plan sets limits at specific frequencies, or when you need to pin down the source of a tonal noise.
What an octave band is
An octave band is a range of frequencies where the top frequency is double the bottom one. Instead of one overall level, you get a sound level in dB for each band, so you can see where the noise energy sits.
Environmental noise uses ten full-octave bands, named by their centre frequency, from 31.5 Hz up to 16 kHz.
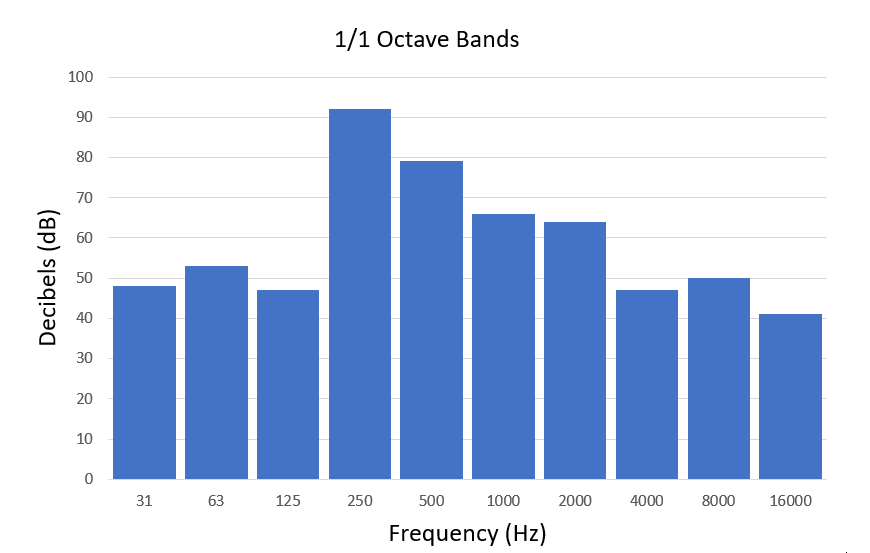
In this example the overall level is made up of ten bands, and the dominant one is at 250 Hz.
Full octave and one-third octave
In SiteHive, you can look at frequency at two levels of detail:
Full octave (1/1): ten bands. Use this for a quick read on whether a noise is mostly low, mid or high frequency.
One-third octave (1/3): each octave is split into three, giving thirty bands over the same range. Use this when a limit is set at a specific frequency, or to pick out a tonal noise such as a hum or a whine.
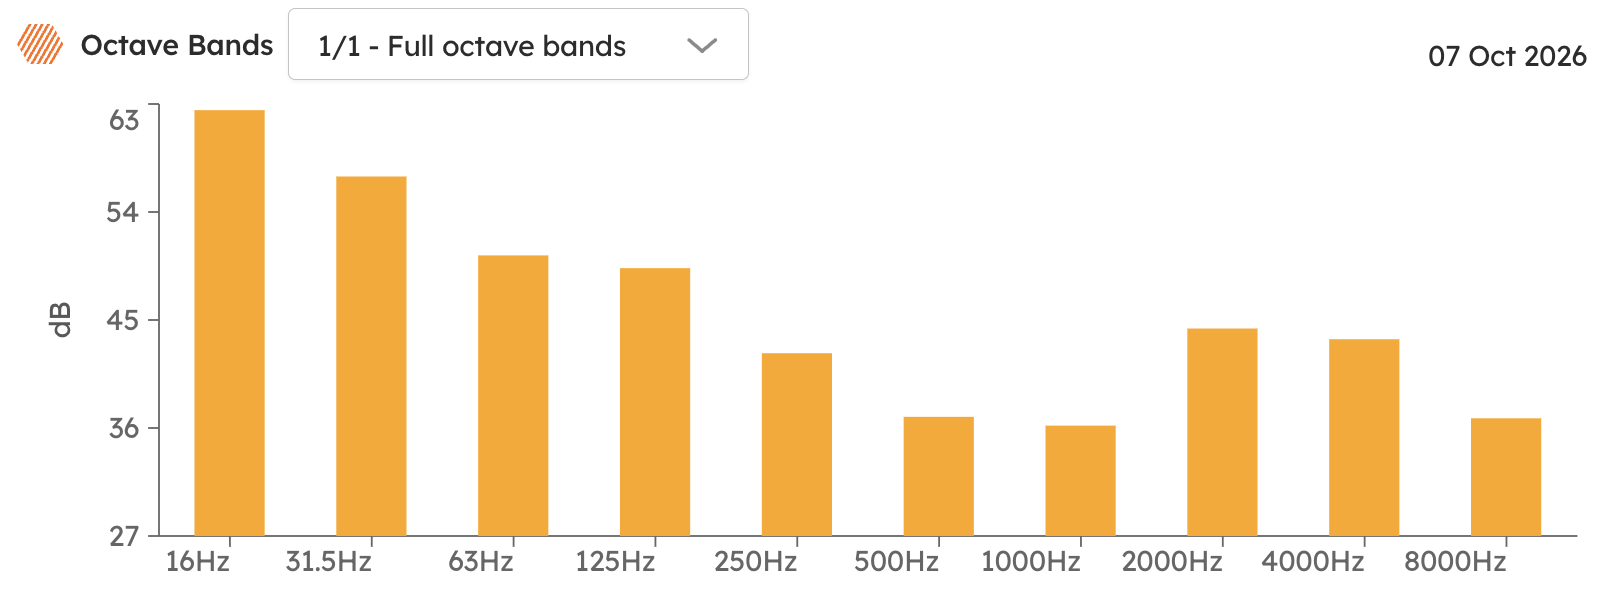
In this example, you can see the noise is dominated in the lowest octave band.
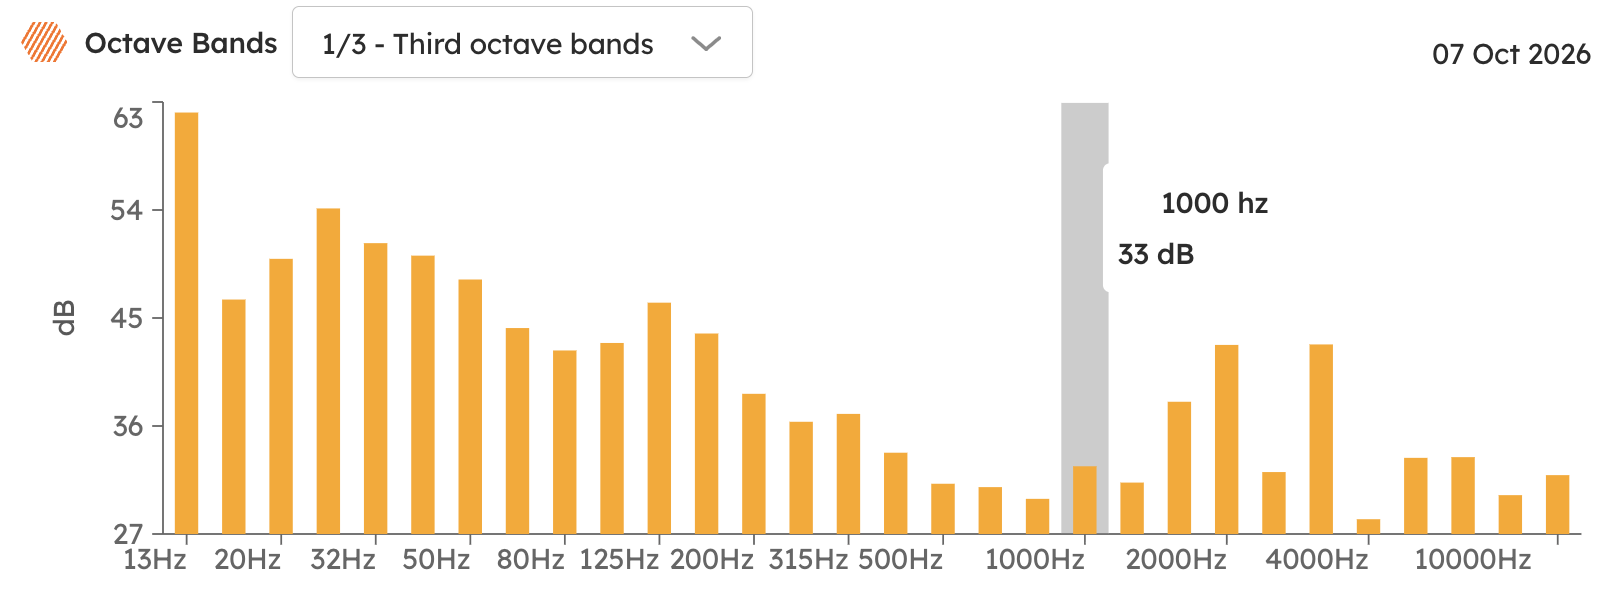
Looking closer, you can see that the noise is dominated almost entirely by the lowest third octave. In this case, a far-off ship engine is creating a dominant, low-frequency rumble that is travelling to resident properties nearby.
Why it matters on site
ome development consents, environmental management plans and operating licences set noise limits for specific frequency bands rather than one overall level.
The most common is a limit on low-frequency noise. Low frequencies travel further and pass through walls more easily. They're also felt as much as heard, so they can drive complaints even when the overall level is within limits.
💡 Tip: If your conditions include a frequency-based limit, check whether it's set in full or one-third octave bands, so you're comparing like with like.
Focus on a time window
The octave bands view follows the time window you select with the timebrush. Instead of the whole day, you can see the frequency make-up of a single spike, a noisy hour or one period of work.
Drag across the noise graph, or across the timeline at the bottom of the Dashboard, to select a window. The octave bands update to show the levels for just that window. Move or resize your selection to compare different windows.
💡 Tip: Select a spike to see which frequencies caused it, then play the audio from the same window to hear what it was. You can also compare a works period with a quiet early-morning period to see which bands your site activity is adding.
Selecting a time window also updates Direction of Arrival, media and the averages beside your Mini Graphs: see Dashboard Overview.
Octave bands and your SiteHive devices
Measured to standard: SiteHive Hexanode Noise devices are tested against IEC 61672-3 (sound level meters) and IEC 61260-1 (octave and fractional-octave filters), so your frequency data stands up in compliance reporting. See SiteHive Noise: what it measures and how and Calibration and certificates.
Frequency in every event (SiteHive Enviro Pro): each noise event includes a spectrogram showing sound energy by frequency over time, which helps you identify what caused an exceedance. See Events: investigate an exceedance.
The same idea for vibration: Vibration Criterion (VC) curves are assessed in one-third octave bands from 1 Hz to 100 Hz.
What's next
Events: investigate an exceedance (images, audio, direction and spectrogram for each exceedance)
Ground-borne noise (low-frequency sound that arrives through the structure)
SiteHive Noise: what it measures and how (the parameters the device records and the standards it meets)